Display statistical results in a table, where rows and columns are defined by how the results are grouped.
The Table widget gives users an at-a-glance view of aggregated data, such as the number of things per customer or the number of alerts per customer by month.
A single table can combine multiple statistics, so different information can be compared side by side, and a Total row summarizes the values of each column.
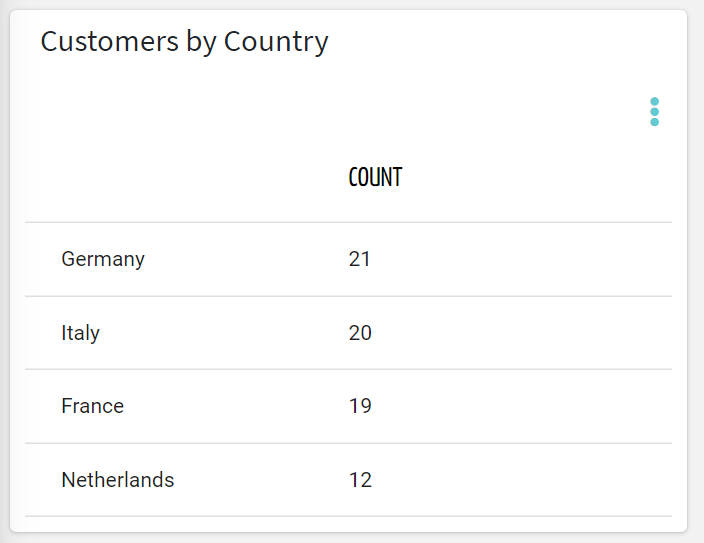
How Data Is Arranged
The table layout is driven by the Group By property of the statistic. The first grouping defines the rows, so each distinct value (for instance, each country) becomes a row.
The optional second grouping defines the columns, so each distinct value becomes a column.
When no grouping is specified, the table shows one row per statistic with its value.
When the underlying objects are distributed over time, such as alerts, events, or work sessions, you can also group by HOUR, DAY, MONTH, or YEAR.
For example, you can list customers as rows and months as columns to see how the count of customers evolve across months.
Multiple Statistics
A table can include more than one statistic. The results of all statistics are merged into a single table, with rows based on the categories of the first grouping, and each statistic contributing its own values.
This lets users compare different information in the same view, for instance the number of work sessions and the number of outcome pieces for each customer’s machine, without switching between widgets.
Totals
The table includes a Total row at the bottom, summarizing the values of each column.
NOTE Totals are calculated and automatically displayed only for columns based on a COUNT or SUM aggregation.
For statistics using AVG, MIN, MAX, or LAST, the Total cell is left empty, since adding up these values would not produce a meaningful result.
If no columns support the total value, the Total row is hidden.
Template Syntax
Below you can find some examples of how to use the component within a template.
// single statistic
<table-widget [title]="'Machines by Model'" headerFilter="dictionary:{'showIcon':false,'showValue':false,'showLabel':true}" queryFieldRef="query">
        <statistic resource="THING" aggregation="COUNT" [groupBy]="['productModel.name', 'properties.connected_machine']" sortDirection="ASC"></statistic>
</table-widget>

// multiple statistics
<table-widget [title]="'Distribution by Country'">
        <statistic label="Things" resource="THING" [groupBy]="['customer.country']" sortDirection="DESC"></statistic>
        <statistic label="Customers" resource="CUSTOMER" [groupBy]="['country']" sortDirection="DESC"></statistic>
</table-widget>
Component Reference
Here is a comprehensive list of all the elements and properties that can be used to configure the component.
Table <table-widget>
Category Column Header | The label to be used as category column header. Name: categoryHeader Type: STRING | Optional
|
Category Filter | The filter used to transform category names (first column in case of group-by). Name: categoryFilter Type: FILTER | Optional
|
Export Enabled | The boolean flag indicating whether the data export is enabled. Name: exportEnabled Type: BOOLEAN | Optional Default Value: false
|
Header Filter | The filter used to transform header names in case of double group-by. Name: headerFilter Type: FILTER | Optional
|
Show Headers | The flag that indicates whether to display the table column headers. Name: showHeaders Type: BOOLEAN | Optional Default Value: true
|
Title | The title displayed on the top part of the widget box. Name: title Type: STRING | Optional
|
Value Filter | The filter used to transform values. Name: valueFilter Type: FILTER | Optional
|
Data | |
Default Period | The default period to use when computing statisticts. Name: period Type: PERIODS | Optional
|
Period Filter Enabled | The boolean flag indicating whether the embedded period filter is available. Name: filterEnabled Type: BOOLEAN | Optional Default Value: false
|
Period Variable | The id of the page's variable providing the date range filtering period, for instance the id of a <period-filter-field>. Name: periodRef Type: STRING | Optional
|
Query Variable | The id of the page's <things-filter-field> used for searching. Name: queryFieldRef Type: STRING | Optional
|
Rendering | |
Availability | Configure availability based on active features on Digital Plan on Add-ons Name: hasFeature Type: FEATURE (multiple) | Optional
|
CSS Class | The name(s) of the CSS class used to customize the widget layout. Name: class Type: STRING | Optional
|
Visibility Condition | The expression that allows you to reduce the visibility of the element. Name: *ngIf Type: STRING | Optional
|
Sub Elements | |
The statistic whose values are to be displayed in the table. | |
Statistic <statistic>
Aggregation | The function used to aggregate data. Name: aggregation Type: ENUM | Optional Values: AVG, COUNT, MAX, MIN, SUM, LAST
|
Averaged By | The count used to average the statistic results (e.g. Average alert count by thing). Name: averagedBy Type: ENUM | Optional Values: thingCount
|
Group By | The property used to group results. For instance: customer.country. In the case where the underlying objects are temporally distributed you can also aggregate by HOUR, DAY, MONTH and YEAR. Name: groupBy Type: GROUP_BY | Optional
|
| The flag indicating whether to include or not the alerts with zero occurrences. Name: includeZeroValues Type: BOOLEAN | Optional Default Value: false
|
Label | The alternative label to be used forto display the statistic in the table as category or header. Name: label Type: STRING | Optional
|
| The statistic whose results(s) must be loaded by the widget. Name: name Type: STATISTIC | Required
|
Property | The object property whose values must be aggregated. Name: property Type: PROPERTY | Optional
|
Resource | The resource from which to retrieve the items to be used to calculate the statistic. Name: resource Type: ENUM | Required Values: ACTION, ALERT, EVENT, CUSTOMER, LOCATION, PARTNER, THING, USER, WORK_SESSION Default Value:
|
Sorting | The sort direction used to order categories by value (default none). Name: sortDirection Type: ENUM | Optional Values: ASC, DESC
|
Status | Define whether to include alerts that are still active, or have been activated in a period. Name: activationType Type: ENUM | Optional Values: ACTIVE, ACTIVATED
|
Value Filter | The name of the filter used to transform and display values. Name: filter Type: FILTER | Optional
|
Data | |
Max Result Count | The number of maximum returned results (default all results are returned). Name: limit Type: INTEGER | Optional
|
Period Variable | The id of the page's variable providing the date range filtering period, for instance the id of a <period-filter-field>. Name: periodRef Type: STRING | Optional
|
Query | The array of conditions filtering out items. For instance: [query]='[{'property': 'connectionStatus', 'predicate': 'eq', 'value': '1'}]' Predicates: eq, beginsWith, like, notLike, isEmpty, isNotEmpty, gt, gte, lt, lte. Name: query Type: QUERY | Optional Predicates: beginsWith, eq, neq, gt, gte, isEmpty, isNotEmpty, lt, lte, like, notLike
|
Full Syntax Example
<table-widget
    [title]="'Table'"
    [showHeaders]="false"
    [exportEnabled]="true"
    categoryHeader="abc"
    headerFilter="dateFormat"
    categoryFilter="dateFormat"
    valueFilter="dateFormat"
    [filterEnabled]="true"
    period="LAST_30_DAYS"
    periodRef="abc"
    queryFieldRef="abc"
    class="my-custom-class"
    *ngIf="getUser().organizationId != null"
    hasFeature="['feature_a', 'feature_b']">
    <statistic
            label="Nr. of Events"
            resource="ACTION"
            activationType="ACTIVE"
            aggregation="AVG"
            groupBy="customer.name"
            property="propName"
            sortDirection="ASC"
            averagedBy="thingCount"
            filter="fooBarFilter"
            name="alertCount"
            [includeZeroValues]="true"
            periodRef="period"
            query="[{property:'prop1', predicate: 'eq', value: 'foo'}, {property:'prop2', predicate: 'in', value: ['bar', 'baz']}]"
            limit="123"></statistic>
</table-widget>