New Pie Chart widget
Many decisions start from knowing how a whole is split into parts: where a machine’s time goes, which item drives a cost, or how much of the installed base still needs attention. A pie chart answers these questions at a glance, without comparing numbers one by one.
The Pie Chart has been revised with new layout options and features.
.png?sv=2026-02-06&spr=https&st=2026-11-12T23%3A57%3A18Z&se=2026-11-13T00%3A11%3A18Z&sr=c&sp=r&sig=Kx8XkR0v1Ce%2FnzozecPfqyNdLTjT36U1x%2BLyyjgLaRY%3D)
What the new pie chart includes:
Metrics aggregation
Metric values can now be aggregated over the selected period (SUM,AVG,MIN,MAX,DELTA). A slice can show, for instance, the hours a machine spent in an operating state during a shift, instead of only the latest value. In customer and location pages, a metric can also be displayed with one slice per product, for instance, to see how production was split across the machines of the same plant.Statistics aggregation
Statistics can group the values of a numeric property into ranges, each displayed as a slice.
For instance, the chart can show how many products fall within each range of produced pieces.New layout preferences
By default, the chart is displayed as a donut with the total in the center. Optionally, you can switch back to the standard pie chart.
Each slice can show its value, its percentage of the total, or both.
In addition, the legend can be added at the bottom or on the right of the widget.Period, search, and export
DPS users can change the period through a Period Field and narrow down the results included through a Search Field on the same page.
If enabled, they can also export the displayed data.
In the Console, the new Pie Chart is available in the Template Editor with this tag <pie-chart-widget-v2>.
The previous Pie Chart is now deprecated. Existing widgets keep working until May 31, 2027, when the previous Pie Chart will be removed, so we recommend migrating your templates to the new Pie Chart before then.
Bar Chart with Work Sessions and Thresholds
Comparing values side by side is the quickest way to see what stands out: which machine produced the most, which failure caused the longest downtime, which batch fell behind. A bar chart puts these values on the same scale, so differences and outliers are immediately visible.
The Bar Chart can now display individual work sessions and compare values against reference lines, so DPS users can quickly spot what did not reach its target.
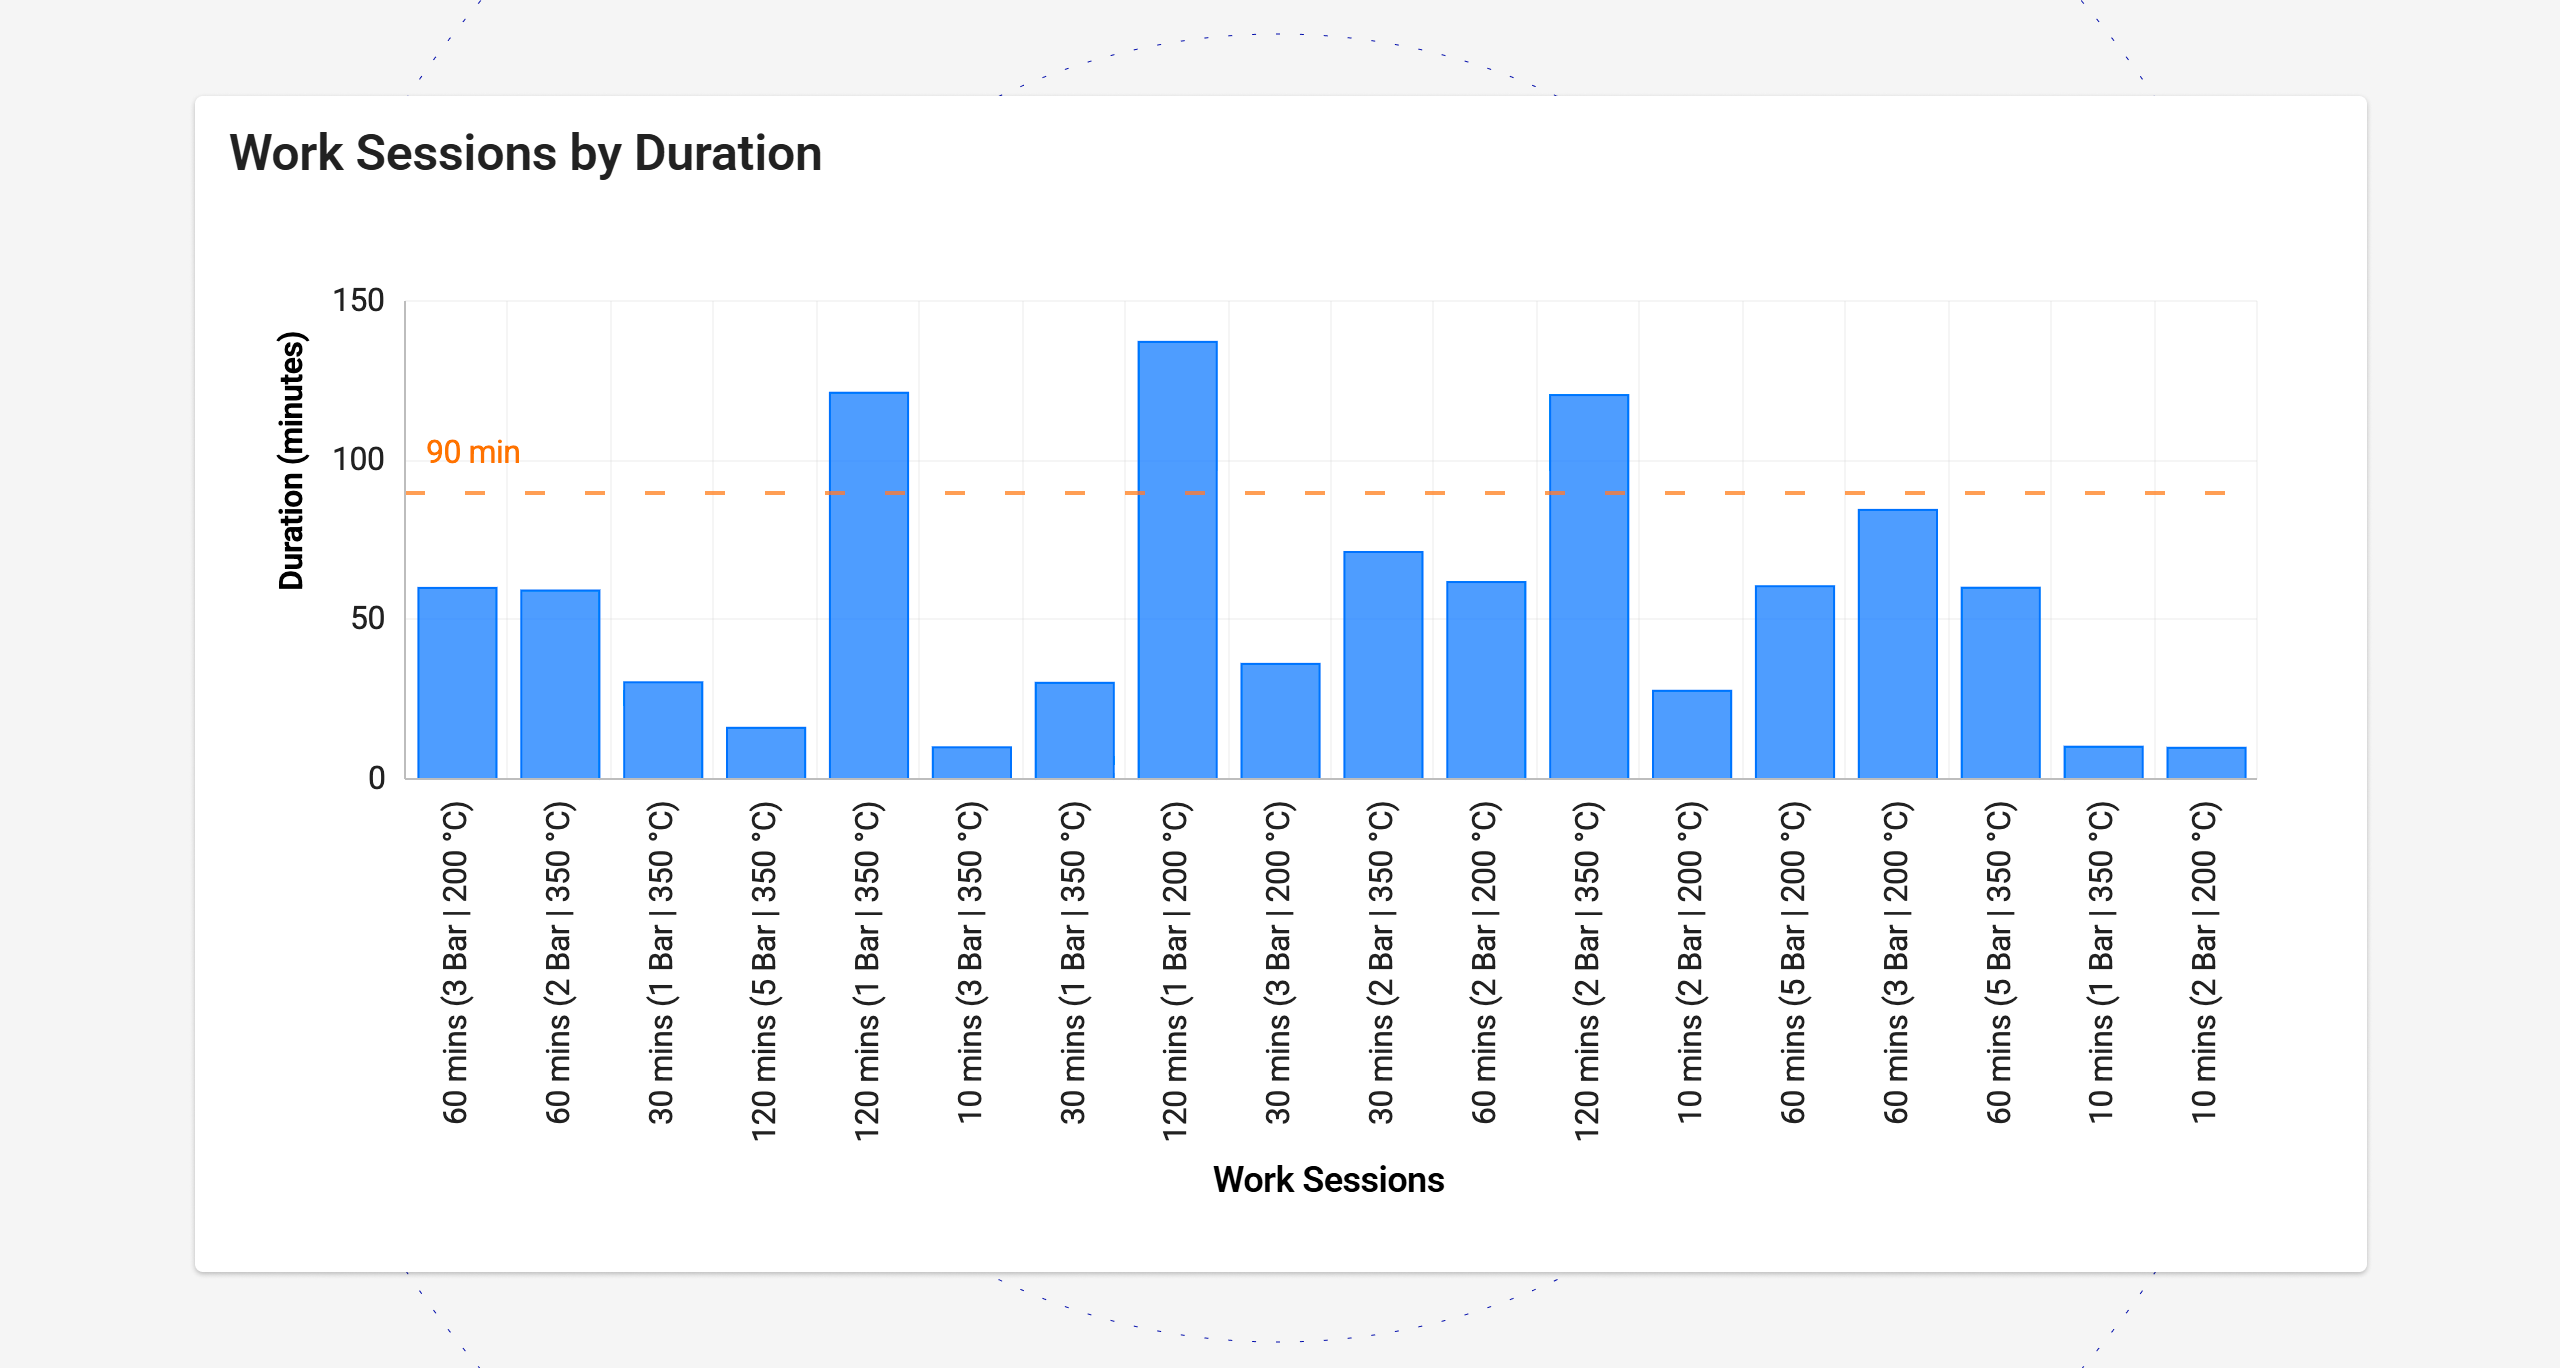
One bar per work session
The chart can display the work sessions of the selected period, with one bar for each session. The bar value is a work session property, such as the duration, a monitored metric (e.g., number of pieces produced), or the value of a post-computation. Operations managers can compare cycles, batches, or jobs side by side and find the ones that performed worse than the others.
When the selected period contains many Work Sessions, the widget automatically displays a horizontal scrollbar.
Thresholds
Thresholds are displayed as horizontal lines across the chart, such as a production target or a maximum allowed speed or time (e.g., 90 minutes), so users can see at a glance which bars are above or below them. The threshold value can come from:
A constant, for a fixed target.
A property, such as a nominal value defined for the product.
A metric, such as a setpoint read from the machine.
A page input, such as a value entered by the DPS user on the same page.
Used together, work sessions and thresholds show, for instance, which production batches reached the expected output and which did not.
In the Console, both options can be configured on the Bar Chart in the Template Editor.
For work sessions, add the new Work Session subelement and choose the property to display as label and bar value.
By default, the title of the work sessions is used as labels on the X-axis, but you can display whichever property you prefer (e.g., a monitored metric providing the name of the executed program).
For each Threshold, choose where its value comes from: a constant, a property, a metric, or a page input.
Centralized management of authentication for third-party systems
Automations and the API Gateway let the DPS work with third-party systems, for instance, to update the CRM or to retrieve data from an external service. Most of these endpoints require authentication. Until now, credentials had to be entered in each endpoint definition, so renewing an expired password or token meant finding and updating every place where it was used.
Authentications can now be defined once, in a single place, and referenced by all the endpoints that need them.
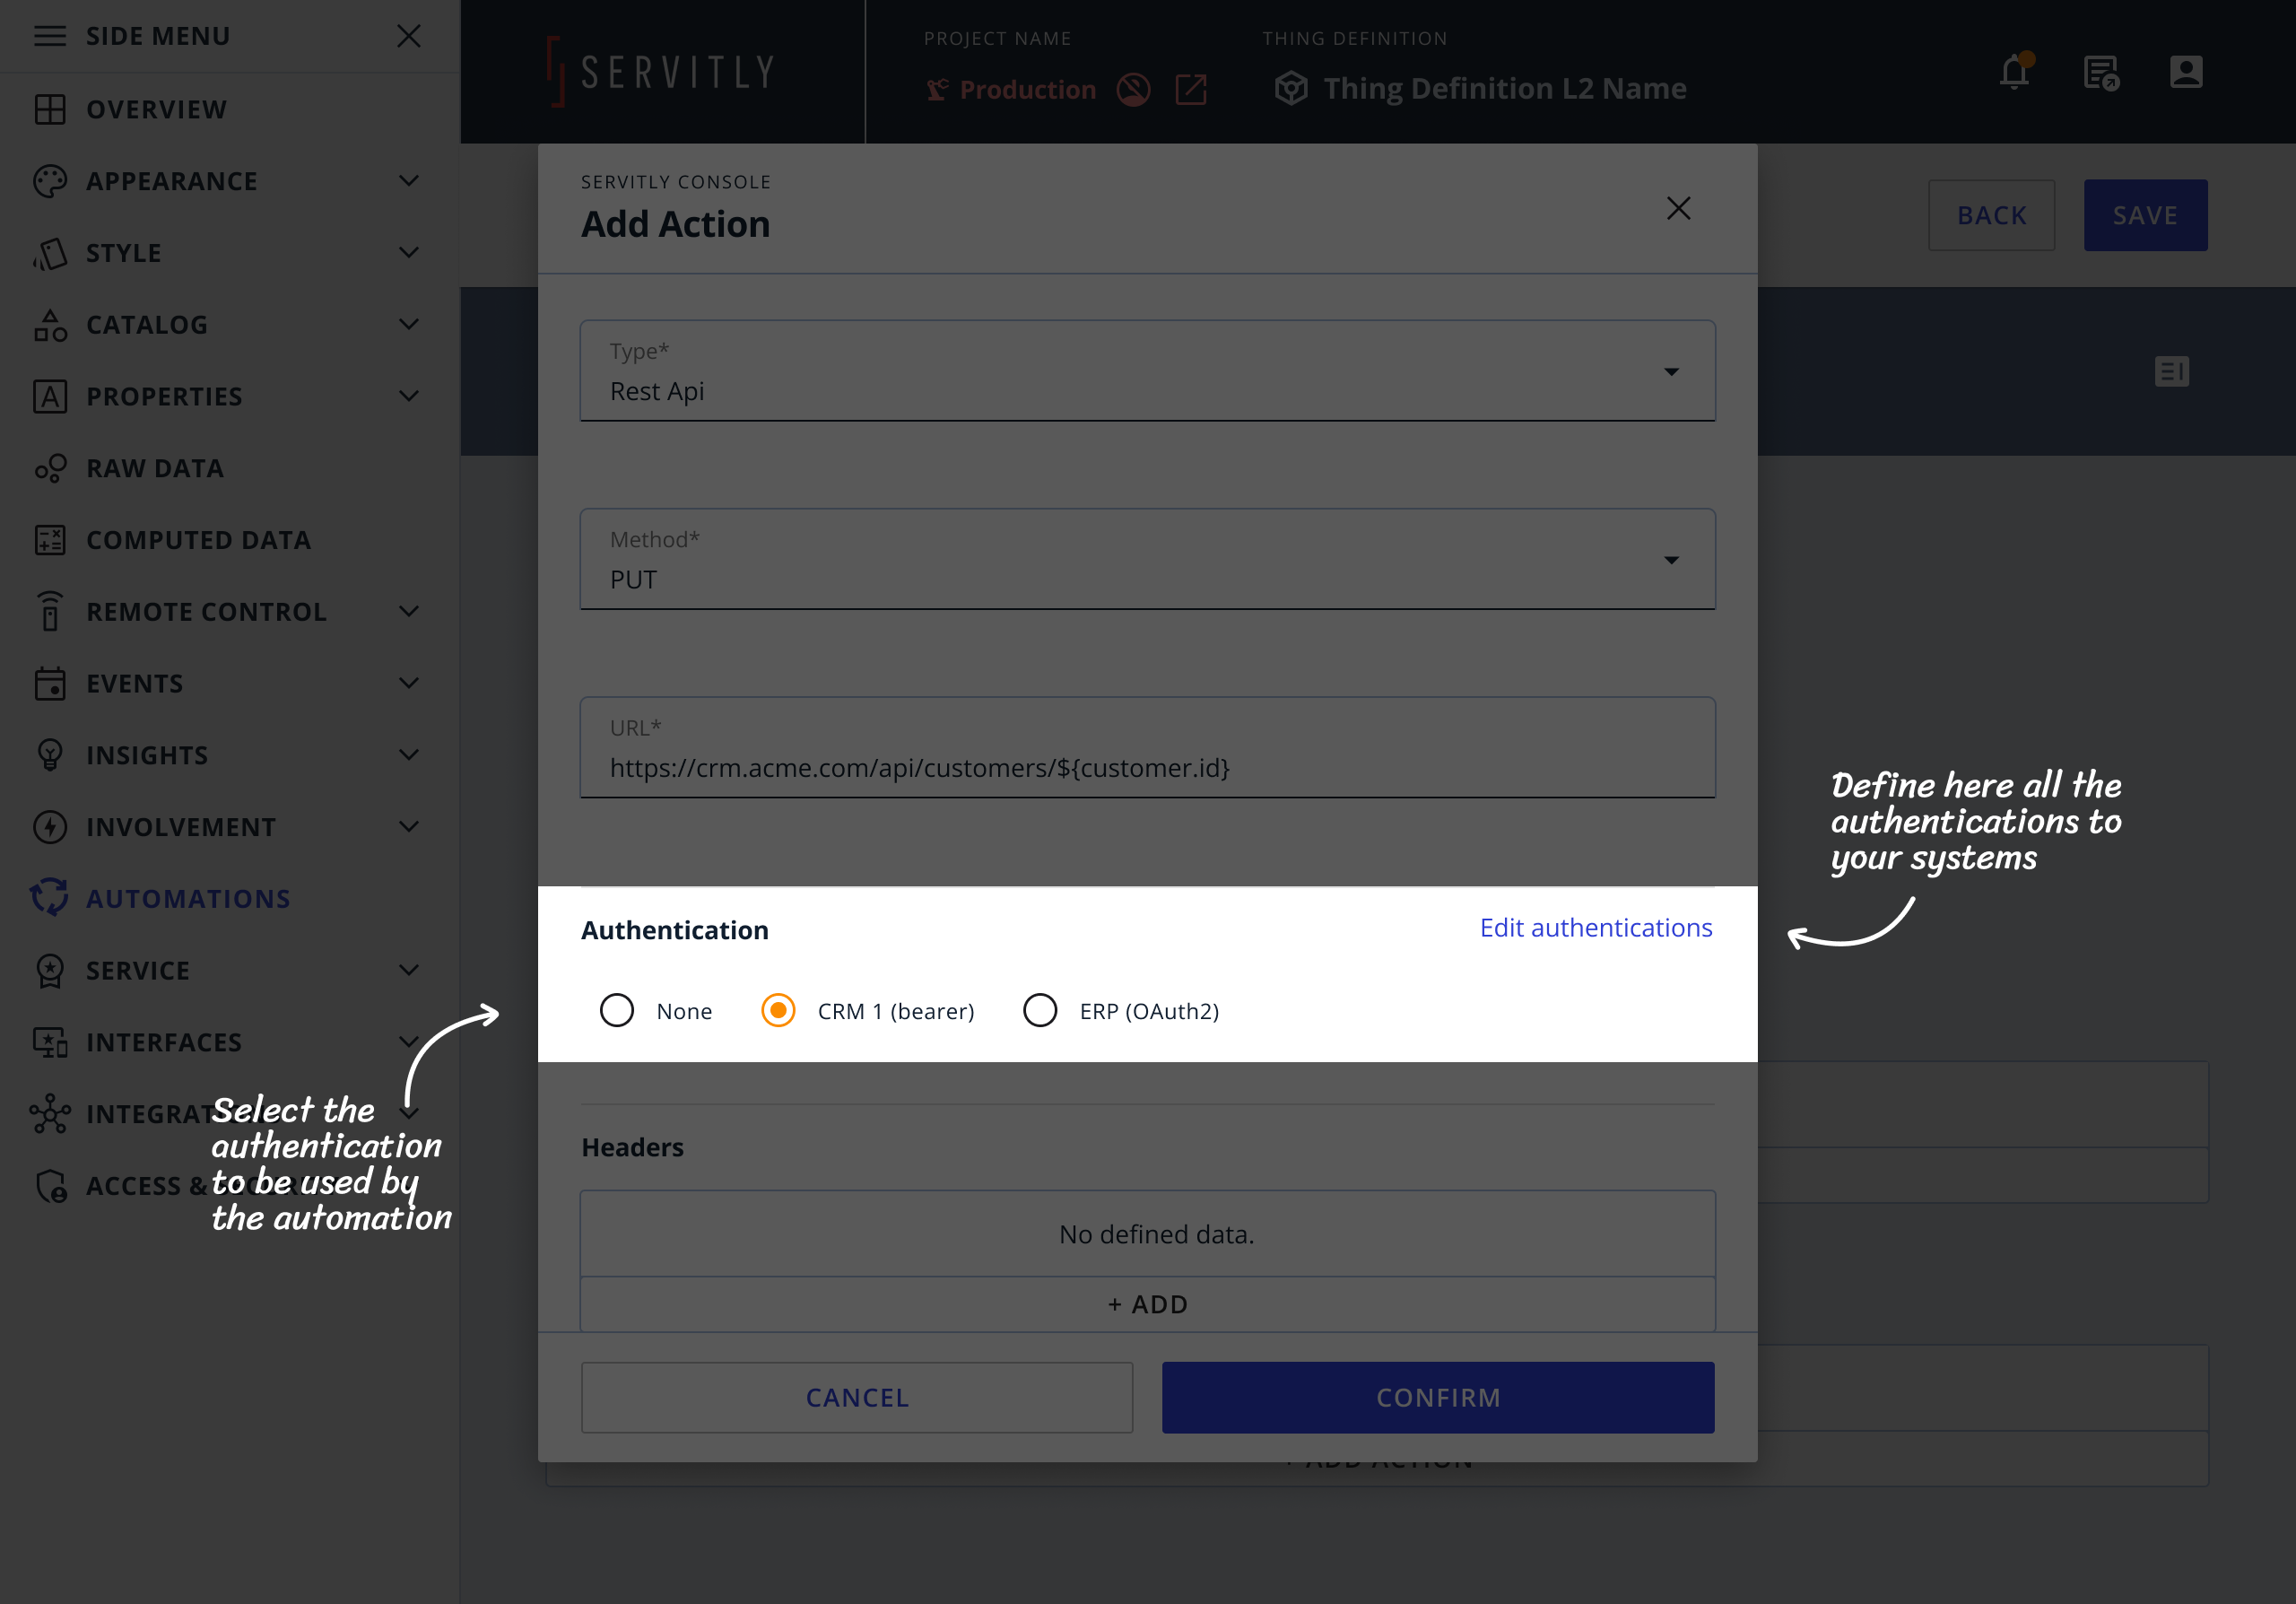
When defining a new authentication, you can select one of the following types:
Basic: base64-encoded username and password.
Bearer: a pre-signed token sent on every request.
OAuth2: before the request, a new access token is obtained via OAuth2.
When credentials change, you update them in one place, and every endpoint that references that authentication uses the new values. This reduces the risk of integrations failing because of an outdated credential.
In the Console, wherever an authentication method can be selected, the Edit Authentications button opens a page where all authentications can be defined and edited in one place. Once defined, an authentication can be selected in any endpoint that requires it.
Fixed bugs:
The Recipe List widget did not notify the user if the applied recipe included parameters that were not enabled at the time of submission.
The Update button in the Configuration Parameters widget was always active, even though all parameters were disabled.