This component provides templates that display the machine's health status for different user profiles and levels of detail.
Health Thing Details
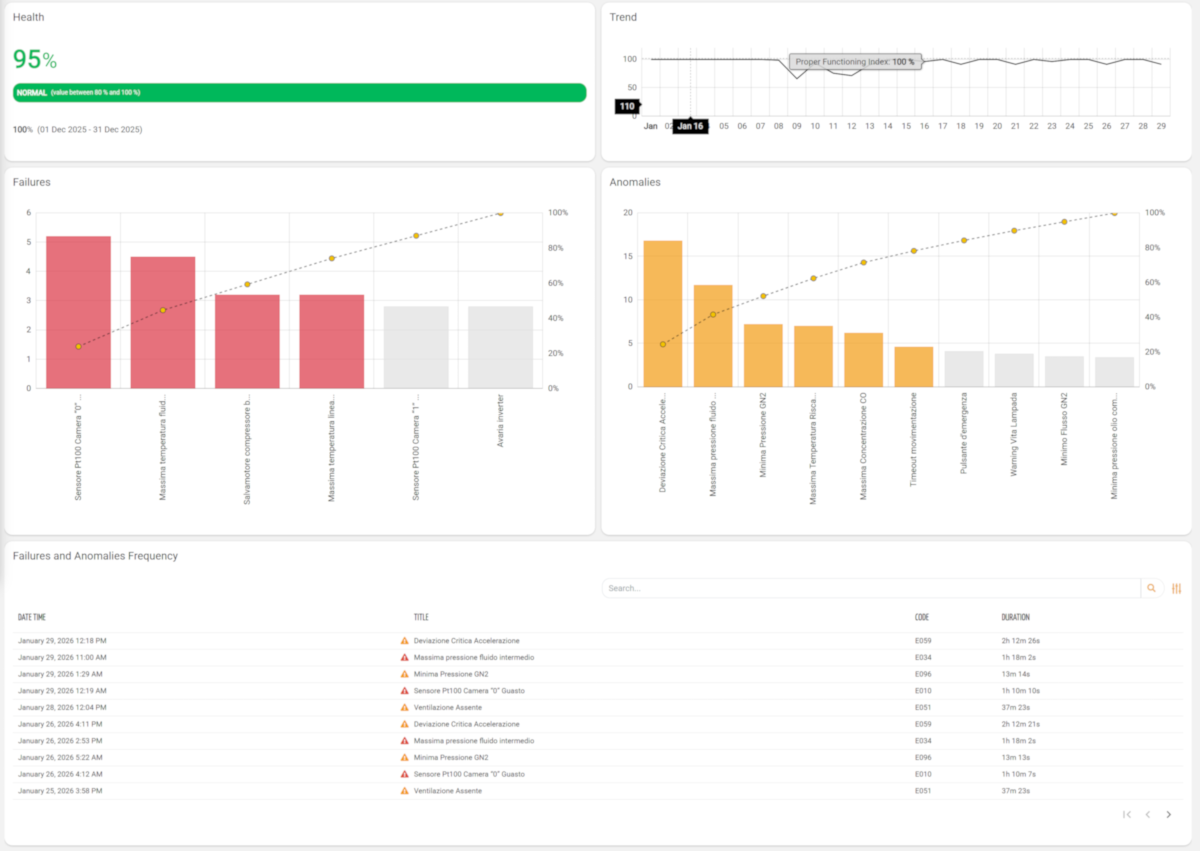
This template displays the health details for a product.
It can be used within the detail view of a thing, either as a full page or as a reusable fragment embedded alongside other content.
Template name | health_thing_details |
Usage | Thing Details Page |
Target users | Operation Manager |
This template requires a Period Field with id "period" placed in the Control Bar template.
<div class="d-flex flex-wrap components-row">
	<value-widget [title]="'Health'" [showPreviousValue]="true" showIncrement="true" aggregation="AVG" periodRef="period" class="w3 card-border flex-fill">
		<metric name="proper_functioning_index" filter="singleDecimalFormat"></metric>
	</value-widget>
	<micro-chart-widget [title]="'Trend'" periodRef="period" class="card-border flex-fill">
		<metric name="proper_functioning_index" filter="singleDecimalFormat" unit="%"></metric>
	</micro-chart-widget>
</div>
<div class="d-flex flex-wrap components-row">
	<benchmark-widget [title]="'Health benchmark (Last 30 Days)'" target="THING" valueProperty="properties.proper_functioning_index_LAST_30_DAYS" valueFilter="integerFormat" valueLabel="Health" unit="%" description="Comparison between the health of the machine and other machines with similar characteristics" [maxBarNumber]="10" [clusterProperties]="['thingDefinition.name']" class="w-100" height="150px"></benchmark-widget>
</div>
<div class="d-flex flex-wrap components-row">
	<bar-chart-widget-v2 [title]="'Failures'" class="flex-fill" [config]="{showParetoLine: true, exportEnabled: false, filterEnabled: false, height: '500px'}" [inputs]="{period: 'period'}">
		<statistic label="Failure Time" resource="EVENT" aggregation="SUM" [groupBy]="['title']" property="duration" filter="millisToHoursNotApproximate2" [query]="[{'property':'eventSeverity','predicate':'in','value':[4]}]" [limit]="10" [config]="{color: '#dc3545', unit: 'hours', categoryOrder: 'DESC'}"></statistic>
	</bar-chart-widget-v2>
	<bar-chart-widget-v2 [title]="'Anomalies'" class="flex-fill" [config]="{showParetoLine: true, exportEnabled: false, filterEnabled: false, height: '500px'}" [inputs]="{period: 'period'}">
		<statistic label="Anomaly Time" resource="EVENT" aggregation="SUM" [groupBy]="['title']" property="duration" filter="millisToHoursNotApproximate2" [query]="[{'property':'eventSeverity','predicate':'in','value':[3,2]}]" [limit]="10" [config]="{color: '#F39C12', unit: 'hours', categoryOrder: 'DESC'}"></statistic>
	</bar-chart-widget-v2>
</div>
<div class="d-flex flex-wrap components-row">
	<event-list-widget [title]="'Failures and Anomalies Frequency'" status="CLOSED" [pageSize]="10" [query]="[{'property':'eventSeverity','predicate':'in','value':[2,3,4]}]" periodRef="period" class="flex-fill">
	    <property name="startTimestamp" label="Date Time" filter="millisToDateTime"></property>
		<property name="severity" [showHeader]="false" columnClass="align-content-center column-size-hug"></property>
		<property name="eventSeverity"></property>
		<property name="title"></property>
		<property name="name" label="Code"></property>
		<property name="duration"></property>
	</event-list-widget>
</div>
Health Operation Manager
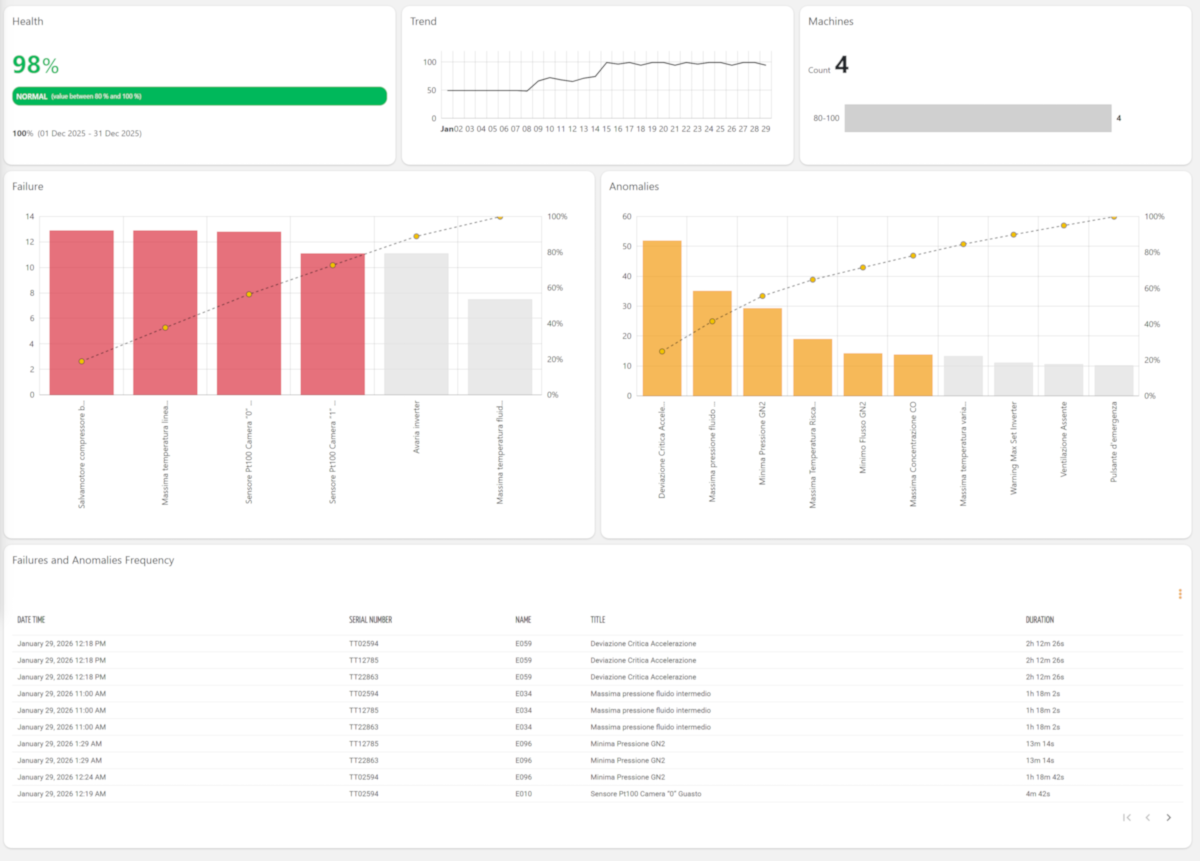
This template displayes an overview of the health of all the customer's machines.
It can be used in a general-purpose page, either as a standalone page or as a fragment combined with other templates.
Template name | health_operation_manager |
Usage | General Page |
Target users | Operation Manager |
<div class="d-flex flex-wrap components-row">
	<value-widget [title]="'Health'" [showPreviousValue]="true" showIncrement="true" aggregation="AVG" periodRef="period" class="w3 card-border flex-fill" queryRef="things">
		<metric name="thing.proper_functioning_index" filter="integerFormat"></metric>
	</value-widget>
	<time-series-chart-widget [title]="'Trend'" class="w3 card-border flex-fill" [config]="{exportEnabled: false, scrollbarEnabled: false, filterEnabled: false, legendPosition: 'none', offlineEnabled: false, height: '200px'}" [inputs]="{period: 'period', query: 'things'}">
		<metric name="thing.proper_functioning_index" filter="integerFormat" [chartOptions]="{rendering: 'COLLAPSED', valueGrouping: 'AVG', color: '#fffffff', fillOpacity: -1, lineWidth: 2, bulletType: 'none', yAxisMin: 0, yAxisMax: 120, smoothedLine: true}"></metric>
	</time-series-chart-widget>
	<bar-chart-widget-v2 [title]="'Machines'" class="w3 card-border flex-fill" [config]="{rotate: true, mode: 'MICRO', height: '96px'}" [inputs]="{period: 'period', query: 'things'}">
		<statistic resource="THING" aggregation="COUNT" [groupBy]="['properties.proper_functioning_index_LAST_30_DAYS']" sortDirection="DESC"></statistic>
		<property label="Count"></property>
	</bar-chart-widget-v2>
</div>
<div class="d-flex flex-wrap components-row">
	<bar-chart-widget-v2 [title]="'Failure'" class="flex-fill" [config]="{showParetoLine: true, exportEnabled: false, filterEnabled: false, height: '500px'}" [inputs]="{period: 'period', query: 'things'}">
		<statistic label="Failures Time" resource="EVENT" aggregation="SUM" [groupBy]="['title']" property="duration" filter="millisToHoursNotApproximate2" [query]="[{'property':'eventSeverity','predicate':'in','value':[4]}]" [limit]="10" [config]="{color: '#dc3545', unit: 'hours', categoryOrder: 'DESC'}"></statistic>
	</bar-chart-widget-v2>
	<bar-chart-widget-v2 [title]="'Anomalies'" class="flex-fill" [config]="{showParetoLine: true, exportEnabled: false, filterEnabled: false, height: '500px'}" [inputs]="{period: 'period', query: 'things'}">
		<statistic label="Anomaly Time" resource="EVENT" aggregation="SUM" [groupBy]="['title']" property="duration" filter="millisToHoursNotApproximate2" [query]="[{'property':'eventSeverity','predicate':'in','value':[3,2]}]" [limit]="10" [config]="{color: '#F39C12', unit: 'hours', categoryOrder: 'DESC'}"></statistic>
	</bar-chart-widget-v2>
</div>
<div class="d-flex flex-wrap components-row">
	<event-list-widget [title]="'Failures and Anomalies Frequency'" status="CLOSED" [pageSize]="10" [query]="[{'property':'eventSeverity','predicate':'in','value':[2,3,4]}]" queryFieldRef="things" periodRef="period" class="flex-fill">
		<property name="startTimestamp" label="Date Time" filter="millisToDateTime"></property>
		<property name="location.name" label="Location"></property>
		<property name="thing.name" label="Chamber"></property>
		<property name="severity" [showHeader]="false" columnClass="align-content-center column-size-hug"></property>
		<property name="eventSeverity"></property>
		<property name="title"></property>
		<property name="name" label="Code"></property>
		<property name="duration"></property>
	</event-list-widget>
</div>