The set of templates to display the machine Uptime for various personas and levels of detail.
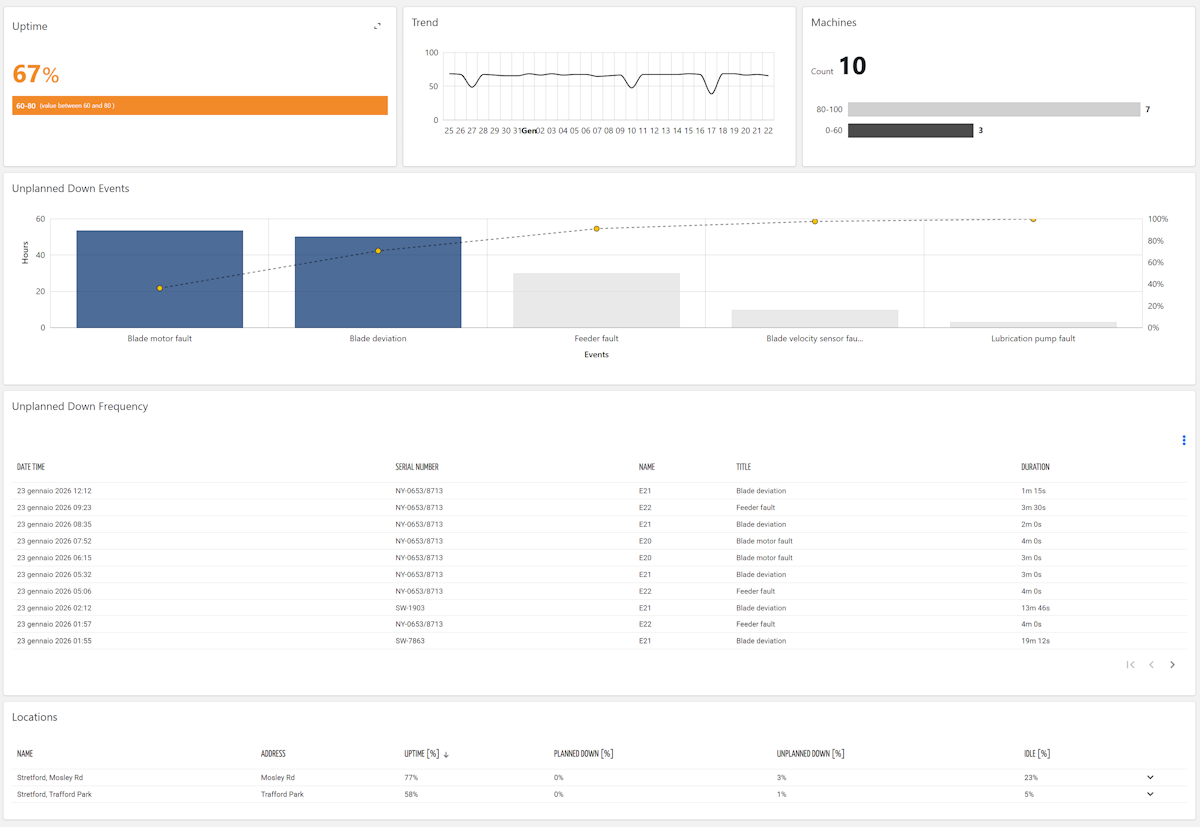
Uptime Overview
This template displayes an overview of the uptime of all the customer's machines.
It can be used in a general-purpose page, either as a standalone page or as a fragment combined with other templates.
Template name | uptime_operation_manager |
Usage | General Page |
Target users | Operation Manager |
This template requires a control bar template, which includes:
a Period Field (ID: period)
a Search Field (ID: things, Search Target: THING)
<div class="d-flex flex-wrap components-row">
<value-widget [title]="'Uptime'" valueMode="VALUE" queryRef="things" class="w3 card-border flex-fill" [expandableDetails]="{template: 'uptime_downtime_distribution', popupTitle: 'Uptime Distribution (Last 30 Days)', expandIcon: 'analytics'}">
<statistic resource="THING" aggregation="AVG" property="properties.uptime_percentage_LAST_30_DAYS" filter="integerFormat" unit="%"></statistic>
</value-widget>
<time-series-chart-widget [title]="'Trend'" class="w3 card-border flex-fill" [config]="{exportEnabled: false, scrollbarEnabled: false, filterEnabled: false, legendPosition: 'none', height: '200px'}" [inputs]="{period: 'period', query: 'things'}">
<metric name="thing.uptime_percentage" filter="integerFormat" unit="%" [chartOptions]="{rendering: 'COLLAPSED', valueGrouping: 'AVG', smoothedLine: true, color: '#fffffff', fillOpacity: -1, lineWidth: 2, bulletType: 'none', yAxisMin: 0, yAxisMax: 100}"></metric>
</time-series-chart-widget>
<bar-chart-widget-v2 [title]="'Machines'" class="w3 card-border flex-fill" [config]="{rotate: true, mode: 'MICRO', height: '96px'}" [inputs]="{period: 'period', query: 'things'}">
<statistic resource="THING" aggregation="COUNT" sortDirection="DESC" [groupBy]="['properties.uptime_percentage_LAST_30_DAYS']"></statistic>
<property label="Count"></property>
</bar-chart-widget-v2>
</div>
<div class="d-flex flex-wrap components-row">
<bar-chart-widget-v2 [title]="'Unplanned Down Events'" class="w-100" [config]="{showParetoLine: true, exportEnabled: false, filterEnabled: false, xAxisLabel: 'Events', yAxisLabel: 'Hours', height: '500'}" [inputs]="{period: 'period', query: 'things'}">
<statistic resource="EVENT" activationType="ACTIVATED" aggregation="SUM" [groupBy]="['title']" property="duration" filter="millisToHoursNotApproximate2" [query]="[{'property':'topics','predicate':'in','value':['HEALTH']}]" [limit]="10" [config]="{color: '#012D6D', unit: 'hours', categoryOrder: 'DESC'}"></statistic>
</bar-chart-widget-v2>
</div>
<div class="d-flex flex-wrap components-row">
<event-list-widget [title]="'Unplanned Down Frequency'" status="CLOSED" [pageSize]="10" [query]="[{'property':'eventSeverity','predicate':'in','value':[4]}]" periodRef="period" class="flex-fill">
<property name="startTimestamp" label="Date Time" filter="millisToDateTime"></property>
<property name="location.name"></property>
<property name="thing.serialNumber"></property>
<property name="severity" [showHeader]="false" columnClass="align-content-center column-size-hug"></property>
<property name="title"></property>
<property name="name" label="Code"></property>
<property name="duration"></property>
</event-list-widget>
</div>
<div class="d-flex flex-wrap components-row">
<location-list-widget-v2 [title]="'Locations'" [sort]="['properties.uptime_percentage_LAST_30_DAYS','desc']" [enableActions]="false" [controlsEnabled]="false" accordionTemplate="uptime_thing_list" class="flex-fill">
<property name="name" label="Name"></property>
<property name="properties.address" label="Address"></property>
<property name="properties.uptime_percentage_LAST_30_DAYS" label="Uptime [%]" filter="integerFormat|dictionary:{'showIcon':true,'showValue':true,'showLabel':true}"></property>
<property name="properties.downtime_planned_perc_LAST_30_DAYS" label="Planned Down [%]" filter="integerFormat|dictionary:{'showIcon':true,'showValue':true,'showLabel':true}"></property>
<property name="properties.downtime_unplanned_perc_LAST_30_DAYS" label="Unplanned Down [%]" filter="integerFormat|dictionary:{'showIcon':true,'showValue':true,'showLabel':true}"></property>
<property name="properties.uptime_idle_perc_LAST_30_DAYS" label="Idle [%]" filter="integerFormat|dictionary:{'showIcon':true,'showValue':true,'showLabel':true}"></property>
</location-list-widget-v2>
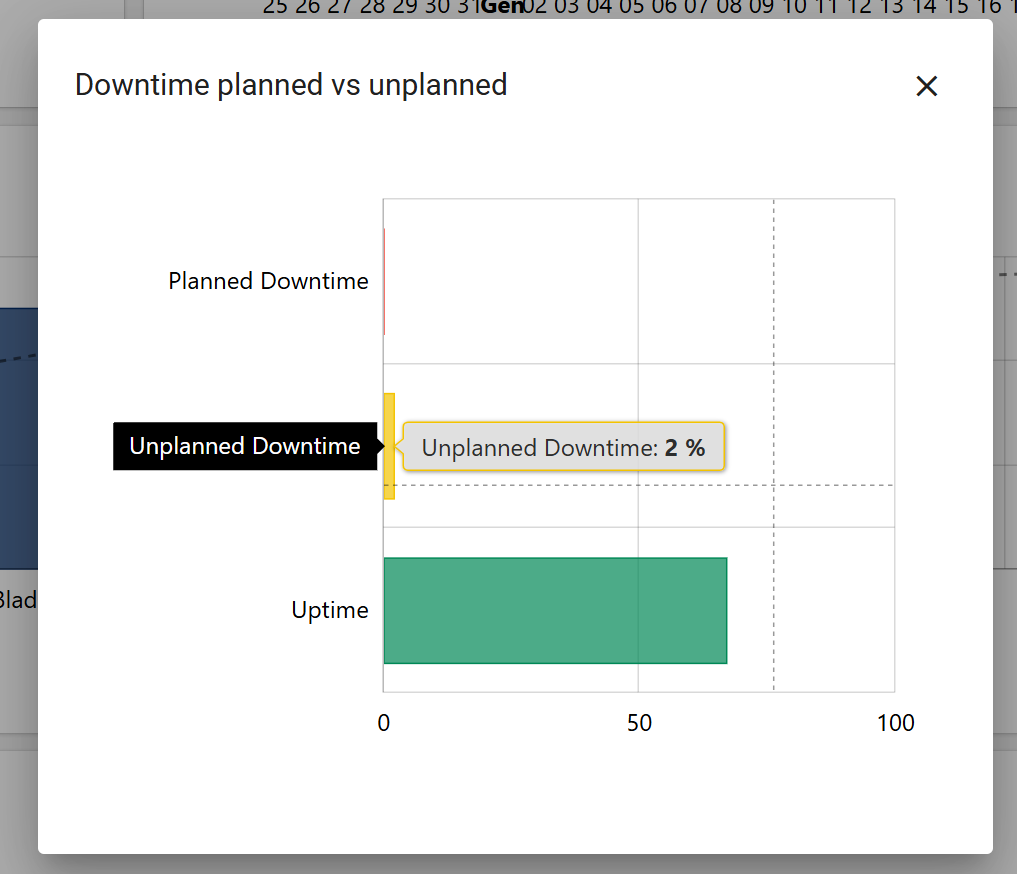
</div>Uptime and Downtime Distribution
This template displays the distribution of Uptime and Downtime (planned and unplanned).
It can be used in a general-purpose page, either as a standalone page or as a fragment combined with other templates.
Template name | uptime_downtime_distribution |
Usage | General Page |
Target users | Any |
<div class="d-flex flex-wrap components-row">
<bar-chart-widget-v2 class="w-100" [config]="{exportEnabled: false, filterEnabled: false, rotate: true, height: '400'}" [inputs]="{period: 'period', query: 'things'}">
<statistic label="Uptime" resource="THING" aggregation="AVG" property="properties.uptime_percentage_LAST_30_DAYS" filter="integerFormat" [config]="{color: '#08B05B', unit: '%'}"></statistic>
<statistic label="Planned Downtime" resource="THING" aggregation="AVG" property="properties.downtime_planned_perc_LAST_30_DAYS" filter="integerFormat" [config]="{color: '#F39C12', unit: '%'}"></statistic>
<statistic label="Unplanned Downtime" resource="THING" aggregation="AVG" property="properties.downtime_unplanned_perc_LAST_30_DAYS" filter="integerFormat" [config]="{color: '#DD4B39', unit: '%'}"></statistic>
</bar-chart-widget-v2>
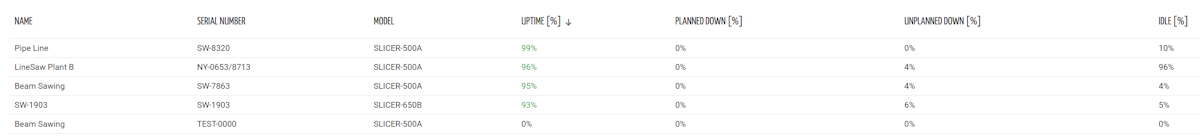
</div>Thing List with Uptime
This template displays a list of products with the uptime indexes columns.
It can be used in a general-purpose page, either as a standalone page or as a fragment combined with other templates.
Template name | uptime_thing_list |
Usage | General Page |
Target users | Any |
<div class="d-flex flex-wrap components-row">
<thing-list-widget-v2 [enableActions]="false" [controlsEnabled]="false" [sort]="['properties.uptime_percentage_LAST_30_DAYS','desc']" class="w-100">
<property name="name"></property>
<property name="serialNumber"></property>
<property name="productModel.name" label="Model"></property>
<property name="properties.uptime_percentage_LAST_30_DAYS" label="Uptime [%]" filter="integerFormat|dictionary:{'showIcon':true,'showValue':true,'showLabel':true}" detailsPath="uptime"></property>
<property name="properties.downtime_planned_perc_LAST_30_DAYS" label="Planned Down [%]" filter="integerFormat|dictionary:{'showIcon':true,'showValue':true,'showLabel':true}"></property>
<property name="properties.downtime_unplanned_perc_LAST_30_DAYS" label="Unplanned Down [%]" filter="integerFormat|dictionary:{'showIcon':true,'showValue':true,'showLabel':true}"></property>
<property name="properties.uptime_idle_perc_LAST_30_DAYS" label="Idle [%]" filter="integerFormat|dictionary:{'showIcon':true,'showValue':true,'showLabel':true}"></property>
</thing-list-widget-v2>
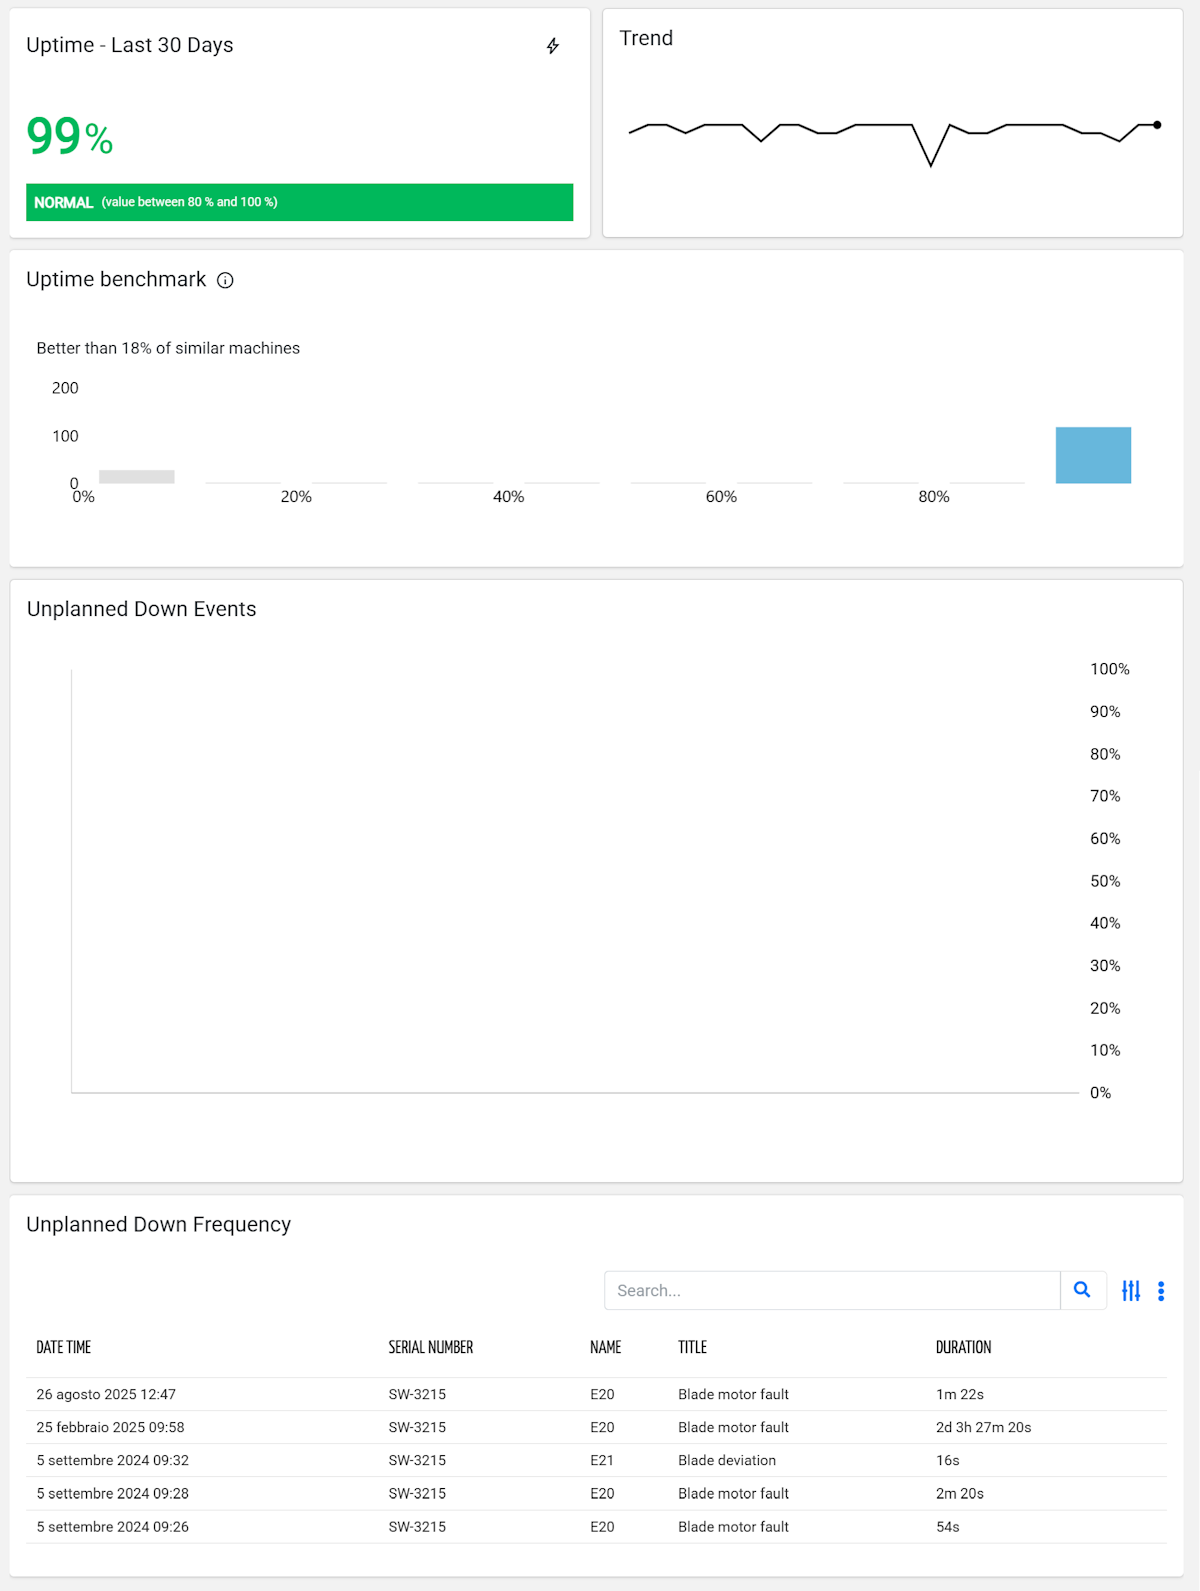
</div>Uptime Thing Details
This template displays the updatime details for a product.
It can be used within the detail view of a thing, either as a full page or as a reusable fragment embedded alongside other content.
Template name | uptime_thing_details |
Usage | Thing Details Page |
Target users | Operation Manager |
This template requires a Period Field with id "period" placed in the Control Bar template.
<div class="d-flex flex-wrap components-row">
	<value-widget [title]="'Uptime'" aggregation="AVG" periodRef="period" class="flex-fill" [expandableDetails]="{template: 'uptime_thing_details_worktime_distribution', popupTitle: 'Uptime Distribution', expandIcon: 'analytics'}">
		<metric name="uptime_percentage" filter="integerFormat" unit="%"></metric>
	</value-widget>
	<micro-chart-widget [title]="'Trend'" periodRef="period" class="card-border flex-fill">
		<metric name="uptime_percentage" filter="integerFormat" unit="%"></metric>
	</micro-chart-widget>
</div>
<div class="d-flex flex-wrap components-row">
	<benchmark-widget [title]="'Uptime benchmark (Last 30 Days)'" target="THING" valueProperty="properties.uptime_percentage_LAST_30_DAYS" valueFilter="integerFormat" valueLabel="Uptime" unit="%" description="Comparison between the uptime of the machine and other machines with similar characteristics" [maxBarNumber]="10" [clusterProperties]="['thingDefinition.name']" class="w-100" height="150px"></benchmark-widget>
</div>
<div class="d-flex flex-wrap components-row">
	<bar-chart-widget-v2 [title]="'Unplanned Down Events'" class="card-border w-100" [config]="{showParetoLine: true, exportEnabled: false, filterEnabled: false}" [inputs]="{period: 'period'}">
		<statistic resource="ALERT" activationType="ACTIVATED" aggregation="SUM" [groupBy]="['title']" property="duration" filter="millisToHoursNotApproximate2" [query]="[{'property':'topics','predicate':'in','value':['HEALTH']}]" [limit]="10" [config]="{color: '#012D6D', unit: 'hours', categoryOrder: 'DESC'}"></statistic>
	</bar-chart-widget-v2>
</div>
<div class="d-flex flex-wrap components-row">
	<event-list-widget [title]="'Unplanned Down Frequency'" status="CLOSED" [pageSize]="10" [query]="[{'property':'eventSeverity','predicate':'in','value':[4]}]" periodRef="period" class="flex-fill">
		<property name="startTimestamp" label="Date Time" filter="millisToDateTime"></property>
		<property name="severity" [showHeader]="false" columnClass="align-content-center column-size-hug"></property>
		<property name="title"></property>
		<property name="name" label="Code"></property>
		<property name="duration"></property>
	</event-list-widget>
</div>
Uptime Thing Details Worktime Distribution
This template displays the worktime, idle time and downtime (planned and unplanned) distribution for a product.
It can be used within the detail view of a thing, either as a full page or as a reusable fragment embedded alongside other content.
Template name | uptime_thing_details_worktime_distribution |
Usage | Thing Details Page |
Target users | Any |
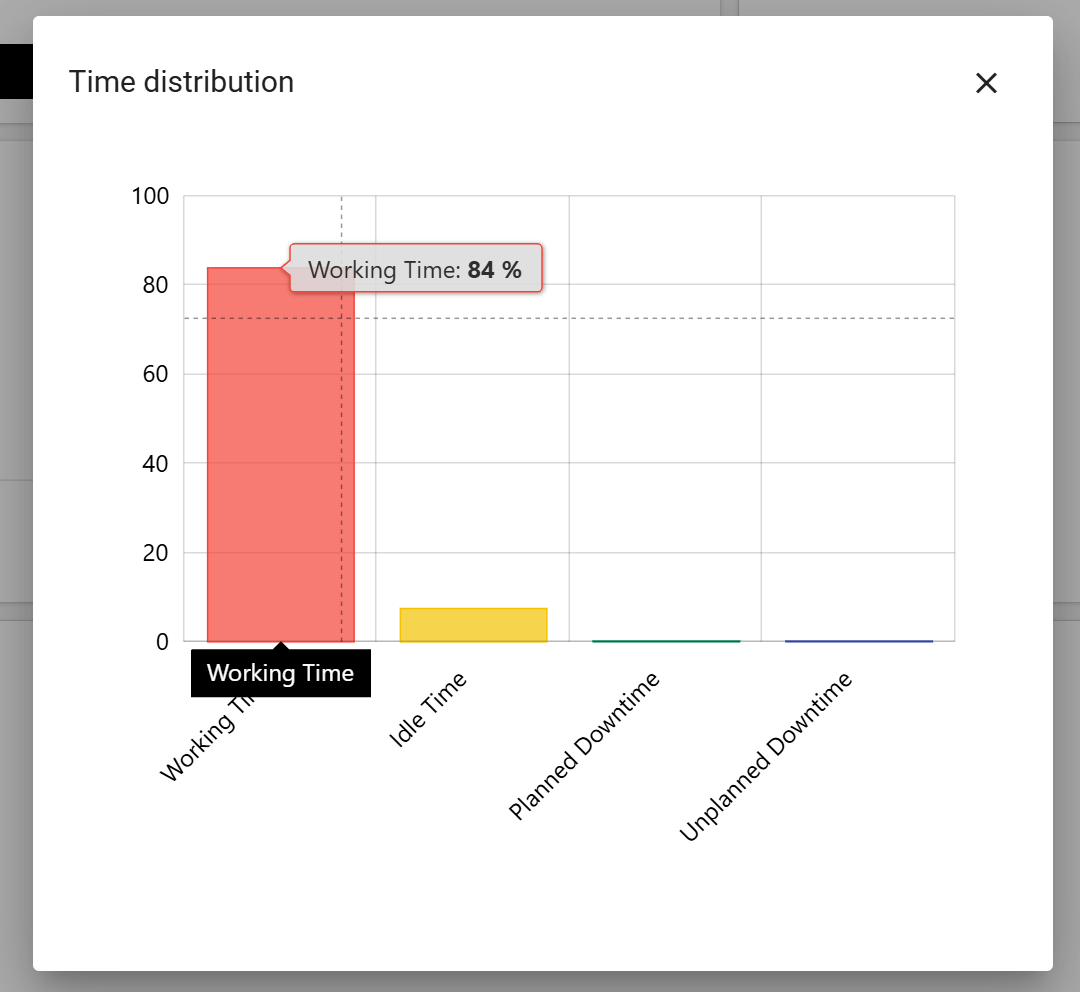
<div class="d-flex flex-wrap components-row">
	<bar-chart-widget-v2 class="w-100" [config]="{exportEnabled: false, filterEnabled: false, width: '600px'}" [inputs]="{period: 'period'}">
		<metric name="working_time_perc" label="Working Time" filter="singleDecimalFormat" unit="%"></metric>
		<metric name="uptime_idle_perc" label="Idle Time" filter="singleDecimalFormat" unit="%"></metric>
		<metric name="downtime_planned_perc" label="Planned Downtime" filter="singleDecimalFormat" unit="%"></metric>
		<metric name="downtime_unplanned_perc" label="Unplanned Downtime" filter="singleDecimalFormat" unit="%"></metric>
	</bar-chart-widget-v2>
</div>