This component provides the templates you can use to display the connection information for the connected products.
The templates below can be used to display the status and quality of the connection, even aggregated on location or customer, helping the various users of the DPS to understand if there is any connectivity problem.
To do this, in addition to the Connection Status metric, it is necessary to configure the Connection Index insight.
Technical templates require defining additional thing properties to save the connection type (Wi-Fi or Cellular), and a metric to register the signal level.
For each template, you can find the list of required data.
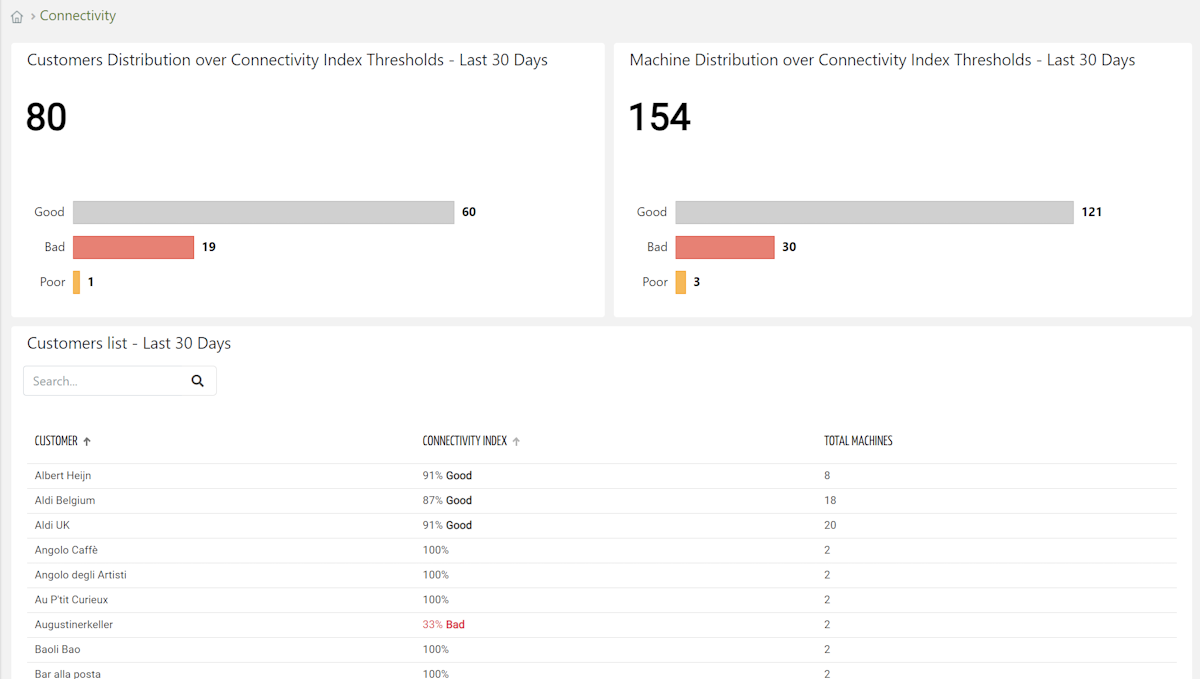
Customers Overview
Visualization of connection analysis among multiple customers.
It can be used in a general-purpose page, either as a standalone page or as a fragment combined with other templates.
Template name | connection_customers_overview |
Usage | General Page |
Target users | Service Manager, Sales Manager |
This template displays:
The number of customers grouped by connection index level.
The number of machines grouped by connection index level.
The list of customers sorted by customer connection index.
<div class="d-flex components-row flex-fill">
	<composite-widget [title]="'Customers Distribution over Connection Index Thresholds - Last 30 Days'" class="flex-fill">
      <div class="d-flex flex-wrap components-row">
         <value-widget [showTitle]="false" valueMode="VALUE" [showColors]="false" [showDetailsBar]="false" class="w-100">
            <statistic resource="customer" aggregation="COUNT"></statistic>
         </value-widget>
         <bar-chart-widget-v2 class="w-100" [config]="{rotate: true, mode: 'MICRO', height: '150px'}" [inputs]="{period: 'period'}">
            <statistic resource="CUSTOMER" aggregation="COUNT" [groupBy]="['properties.connection_index_LAST_30_DAYS']" sortDirection="DESC"></statistic>
         </bar-chart-widget-v2>
      </div>
	</composite-widget>
	<composite-widget [title]="'Machine Distribution over Connection Index Thresholds - Last 30 Days'" class="flex-fill">
      <div class="d-flex flex-wrap components-row">
         <value-widget [showTitle]="false" valueMode="VALUE" [showColors]="false" [showDetailsBar]="false" class="w-100">
            <statistic resource="thing" aggregation="COUNT"></statistic>
         </value-widget>
         <bar-chart-widget-v2 class="w-100" [config]="{rotate: true, mode: 'MICRO', height: '150px'}" [inputs]="{period: 'period'}">
            <statistic resource="THING" aggregation="COUNT" sortDirection="DESC" [groupBy]="['properties.connection_index_LAST_30_DAYS']"></statistic>
         </bar-chart-widget-v2>
      </div>
	</composite-widget>
</div>
<div class="d-flex flex-wrap components-row">
	<composite-widget [title]="'Customers list - Last 30 Days'" class="w-100">
		<div class="d-flex flex-wrap components-row">
			<search-field id="query" searchTarget="CUSTOMERS" class="w-100">
				<search-input type="PROPERTY" property="properties.connection_index_LAST_30_DAYS"></search-input>
				<search-input type="KEY"></search-input>
			</search-field>
		</div>
		<div class="d-flex flex-column components-column flex-fill">
			<customer-list-widget-v2 [pageSize]="10" [enableActions]="false" [controlsEnabled]="false" queryFieldRef="query" detailsPath="connection" class="w-100">
				<property name="name" label="Customer"></property>
				<property name="properties.connection_index_LAST_30_DAYS" label="Connection Index" filter="integerFormat|dictionary:{'showIcon':true,'showValue':true,'showLabel':true}"></property>
				<property name="properties.thingCount" label="Total Machines"></property>
			</customer-list-widget-v2>
		</div>
	</composite-widget>
</div>
Thing Details
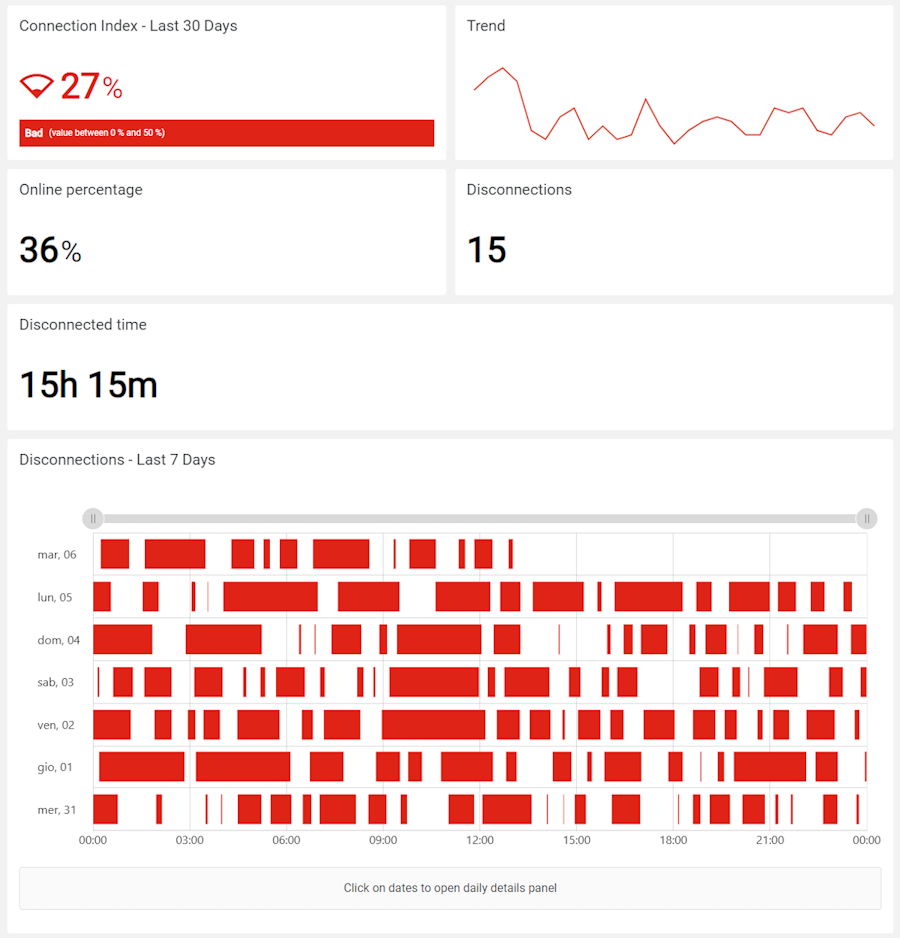
Provides the operations manager with a detailed view of the connection index of a single machine.
It can be used within the detail view of a thing, either as a full page or as a reusable fragment embedded alongside other content.
Template name | connection_thing_details |
Usage | Thing Details Page |
Target users | Operation Manager |
This template displays:
The average value and trend of the connection index over time, highlighted by a threshold.
The percentage of time spent in online status.
The number of disconnections.
The total time disconnected.
The daily details of the connection status.
<div class="d-flex flex-wrap components-row">
	<value-widget [title]="'Connection Index'" periodRef="period" class="flex-fill">
		<metric name="connection_index" filter="integerFormat"></metric>
	</value-widget>
	<micro-chart-widget [title]="'Trend'" periodRef="period" height="121px" class="flex-fill">
		<metric name="connection_index" filter="integerFormat"></metric>
	</micro-chart-widget>
</div>
<div class="d-flex flex-wrap components-row">
	<value-widget [title]="'Online percentage'" aggregation="AVG" periodRef="period" [showColors]="false" [showDetailsBar]="false" class="flex-fill">
		<metric name="connection_index_online_time_perc" filter="integerFormat"></metric>
	</value-widget>
	<value-widget [title]="'Disconnections'" aggregation="SUM" periodRef="period" [showColors]="false" [showDetailsBar]="false" class="flex-fill">
		<metric name="connection_index_disc_count" filter="integerFormat"></metric>
	</value-widget>
	<value-widget [title]="'Disconnected time'" aggregation="SUM" periodRef="period" [showColors]="false" [showDetailsBar]="false" class="flex-fill">
		<metric name="connection_index_offline_time" filter="millisToPeriod"></metric>
	</value-widget>
</div>
<div class="d-flex flex-wrap components-row">
	<metric-state-diagram-widget [title]="'Disconnections'" metricName="Connection Status" periodRef="period" class="w-100">
		<metric-state label="OFFLINE" predicate="lt" value="1" severity="WARNING" stateBarColor="#DF2316"></metric-state>
		<metric name="connection_index_online_time_perc" label="ONLINE %" filter="singleDecimalFormat"></metric>
		<metric name="connection_index" filter="integerFormat"></metric>
	</metric-state-diagram-widget>
</div>
Thing Details Technical
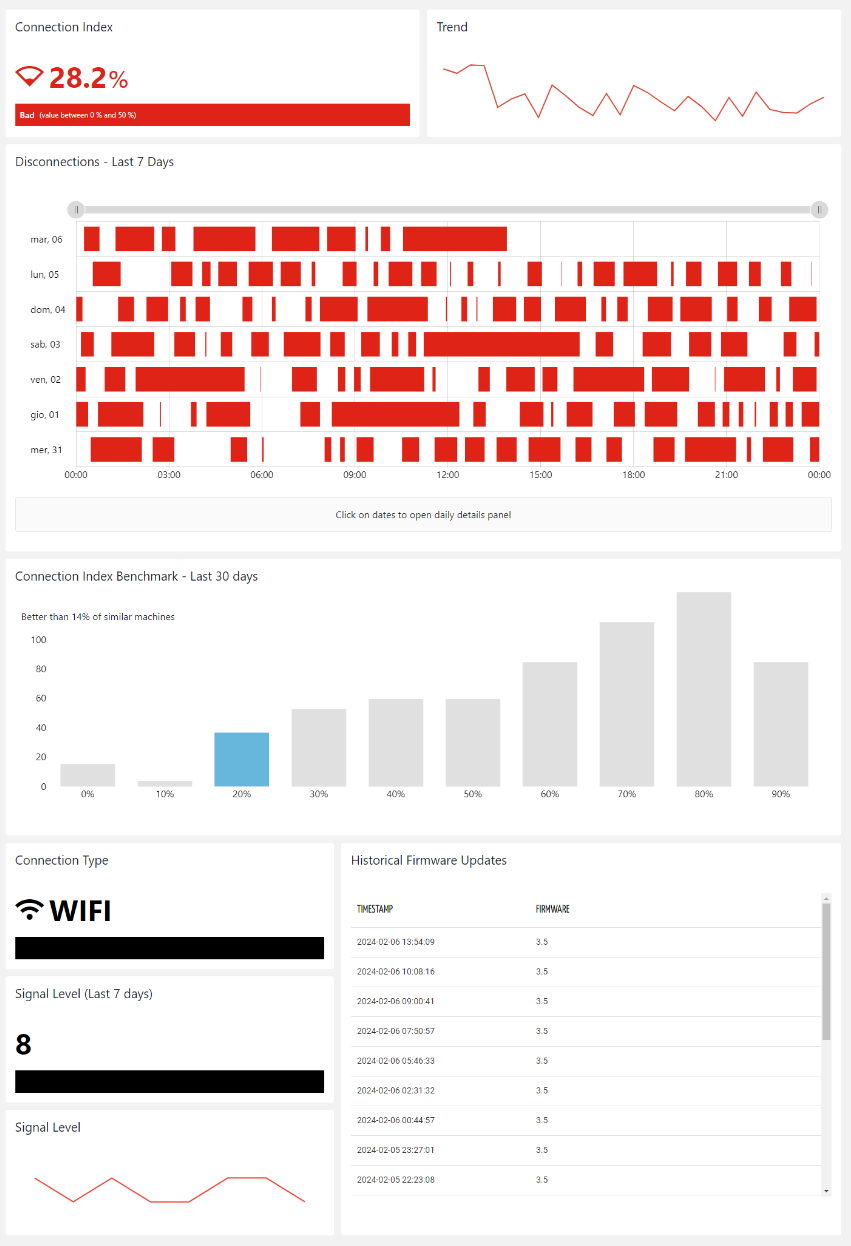
Provides technical users with useful information about the connection of a single machine.
It can be used within the detail view of a thing, either as a full page or as a reusable fragment embedded alongside other content.
Template name | connection_thing_details_technical |
Usage | Thing Details Page |
Target users | Service Technician, Internal Maintenance Technician, R&D Manager |
This template displays:
The type of connection and signal level.
The connection index for the past 30 days.
The details of the connection status for the past 7 days.
The connection index benchmark of the past 30 days compared with similar products.
The Wi-Fi and signal level.
The firmware version history.
<div class="d-flex flex-wrap components-row justify-content-center">
<value-widget [title]="'Connection Index'" class="flex-fill">
<metric name="connection_index" unit="%" filter="singleDecimalFormat"></metric>
</value-widget>
<micro-chart-widget [title]="'Trend'" height="121px" class="flex-fill">
<metric name="connection_index" unit="%" filter="singleDecimalFormat"></metric>
</micro-chart-widget>
</div>
<div class="d-flex flex-wrap components-row">
<metric-state-diagram-widget metricName="Connection Status" predicate="lt" value="1" stateBarColor="#DF2316" [title]="'Disconnections - Last 7 Days'" detailsLabel="Disconnections" totalLabel="Total disconnected time" class="w-100">
<metric name="connection_index" filter="integerFormat|dictionary:{'showIcon':true,'showValue':true,'showLabel':'false'}"></metric>
<metric name="signalLevel" aggregation="AVG"></metric>
</metric-state-diagram-widget>
</div>
<div class="d-flex flex-wrap components-row">
<benchmark-widget [title]="'Connection Index Benchmark - Last 30 days'" target="THING" valueProperty="properties.connection_index_LAST_30_DAYS" valueFilter="integerFormat" valueLabel="Connection Index (Last 30 days)" unit="%" [minValue]="0" [maxValue]="100" [maxBarNumber]="10" [clusterProperties]="['thingDefinition.name']" class="flex-fill" height="300px"></benchmark-widget>
</div>
<div class="d-flex flex-wrap components-row justify-content-center">
<div class="d-flex flex-column components-column align-self-start flex-fill">
<value-widget [title]="'Connection Type'" class="flex-fill">
<property name="properties.connectionType"></property>
</value-widget>
<thing-details-widget [title]="'SIM'" *ngIf="getThing().simDetails?.simIccid">
<property name="simDetails.simIccid" label="ICCID"></property>
<property name="simDetails.simStatus" label="Status"></property>
<property name="simDetails.sessionStatus" label="Session Status"></property>
</thing-details-widget>
<value-widget [title]="'Signal Level (Last 7 days)'" class="flex-fill" period="LAST_7_DAYS">
<metric name="signalLevel" aggregation="AVG"></metric>
</value-widget>
<micro-chart-widget [title]="'Signal Level'" defaultPeriodValue="LAST_7_DAYS" height="118px" class="flex-fill">
<metric name="signalLevel"></metric>
</micro-chart-widget>
</div>
<div class="d-flex flex-column components-column w-50 flex-fill">
<multi-metric-list-widget [title]="'Historical Firmware Updates'" [filterEnabled]="false" defaultPeriodValue="LAST_30_DAYS" class="flex-fill">
<metric name="Firmware"></metric>
</multi-metric-list-widget>
</div>
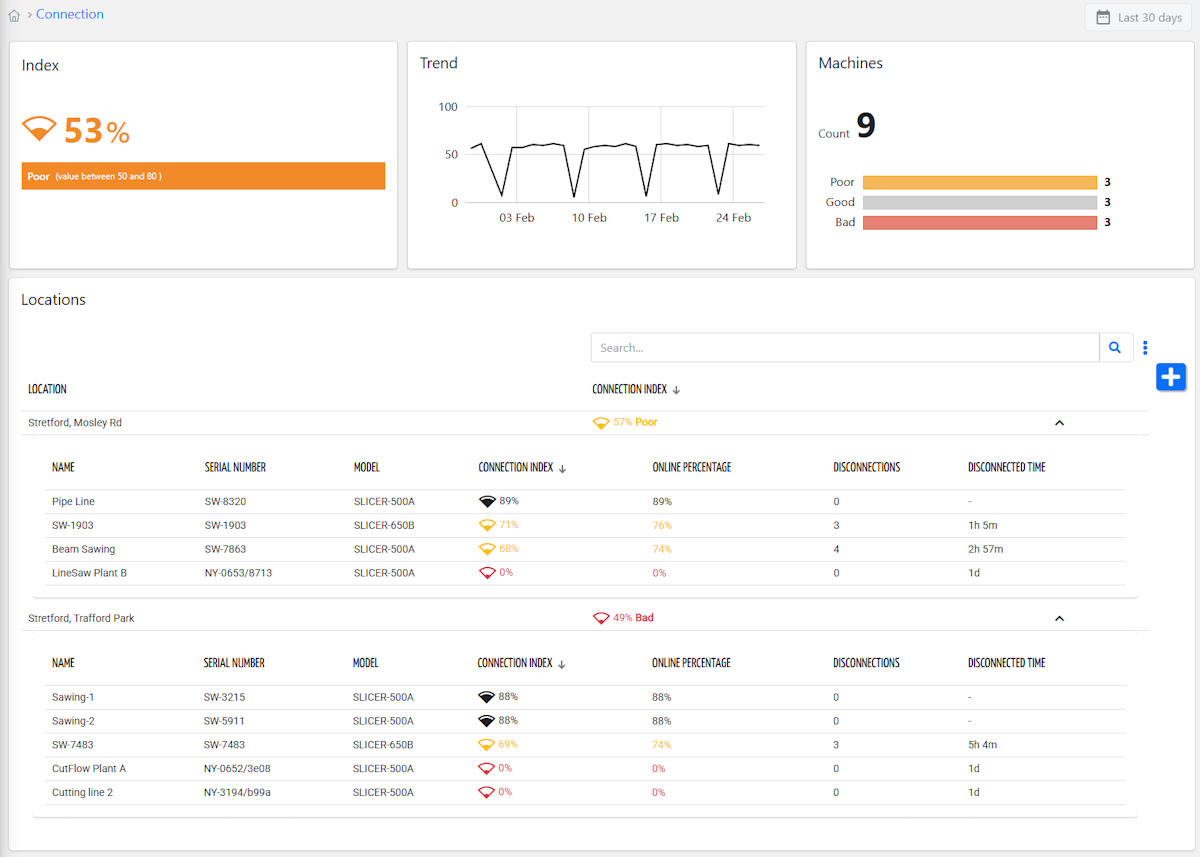
</div>Customer Details
Displays aggregate connection analysis across multiple machines.
It can be used in a general-purpose page, either as a standalone page or as a fragment combined with other templates.
Template name | connection_customer_details |
Usage | General Page |
Target users | Operation Manager, Service Manager |
This template displays:
The average connection index over the selected period.
The trend of the Connection Index over the selected period.
The number of machines grouped by the quality of the Connection Index.
<div class="d-flex flex-wrap components-row">
<value-widget [title]="'Index'" class="w3 card-border flex-fill">
<statistic resource="thing" aggregation="AVG" property="properties.connection_index_LAST_30_DAYS" filter="integerFormat" unit="%"></statistic>
</value-widget>
<time-series-chart-widget [title]="'Trend'" class="w3 card-border flex-fill" [config]="{exportEnabled: false, scrollbarEnabled: false, filterEnabled: false, legendPosition: 'none', height: '200px'}" [inputs]="{period: 'period'}">
<metric name="thing.connection_index" filter="integerFormat" unit="%" aggregation="AVG_DAYS_1" [chartOptions]="{rendering: 'COLLAPSED', valueGrouping: 'AVG', smoothedLine: true, color: '#fffffff', fillOpacity: -1, lineWidth: 2, bulletType: 'none'}"></metric>
</time-series-chart-widget>
<bar-chart-widget-v2 [title]="'Machines'" class="w3 card-border flex-fill" [config]="{rotate: true, mode: 'MICRO', height: '96px'}" [inputs]="{period: 'period'}">
<statistic resource="THING" aggregation="COUNT" sortDirection="DESC" [groupBy]="['properties.connection_index_LAST_30_DAYS']"></statistic>
<property label="Count"></property>
</bar-chart-widget-v2>
</div>
<div class="d-flex flex-wrap components-row">
<location-list-widget-v2 [title]="'Locations'" [sort]="['properties.connection_index_LAST_30_DAYS','desc']" accordionTemplate="connection_thing_list" class="w-100">
<property name="name" label="Location"></property>
<property name="properties.connection_index_LAST_30_DAYS" label="Connection Index" filter="integerFormat|dictionary:{'showIcon':true,'showValue':true,'showLabel':true}"></property>
</location-list-widget-v2>
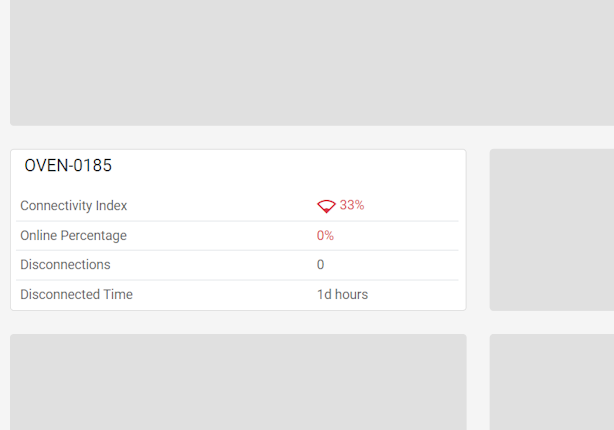
</div>Thing Card Detailed
Displays machine connection information in a card.
It can be used within the detail view of a thing, either as a full page or as a reusable fragment embedded alongside other content.
Template name | connection_thing_card_detailed |
Usage | Thing Details Page |
Target users | Operation Manager, Service Manager |
This template includes:
The connection index of the last day.
The percentage of time spent in online status.
The number of disconnections.
The total disconnection time.
<div class="d-flex flex-wrap components-row">
<thing-details-widget [title]="getThing()?.name" class="card-border flex-fill">
<metric name="connection_index" label="Connection Index" filter="integerFormat|dictionary:{'showIcon':true,'showValue':true,'showLabel':false}"></metric>
<metric name="connection_index_online_time_perc" label="Online Percentage" filter="integerFormat|dictionary:{'showIcon':true,'showValue':true,'showLabel':false}"></metric>
<metric name="connection_index_disc_count" label="Disconnections" filter="integerFormat"></metric>
<metric name="connection_index_offline_time" label="Disconnected Time" filter="millisToPeriod"></metric>
</thing-details-widget>
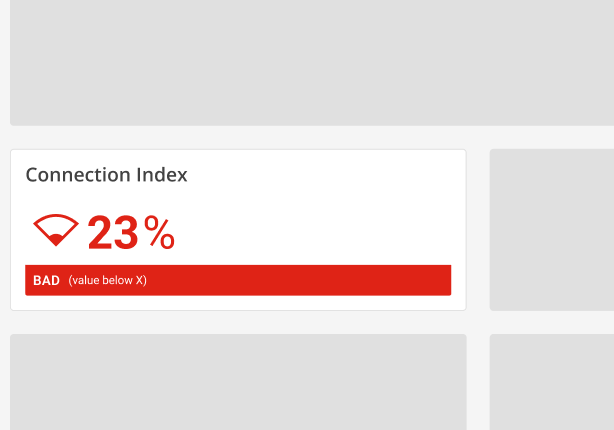
</div>Thing Card Index
Displays the machine connection index over the last 30 days on a card.
It can be used within the detail view of a thing, either as a full page or as a reusable fragment embedded alongside other content.
Template name | connection_thing_card_index |
Usage | Thing Details Page |
Target users | Any |
The value is highlighted according to the connection index thresholds.
In this way, at a quick glance, it will be possible to see if everything is okay.
<value-widget [title]="'Connection Index'" class="flex-fill">
<property name="properties.connection_index_LAST_30_DAYS" filter="integerFormat"></property>
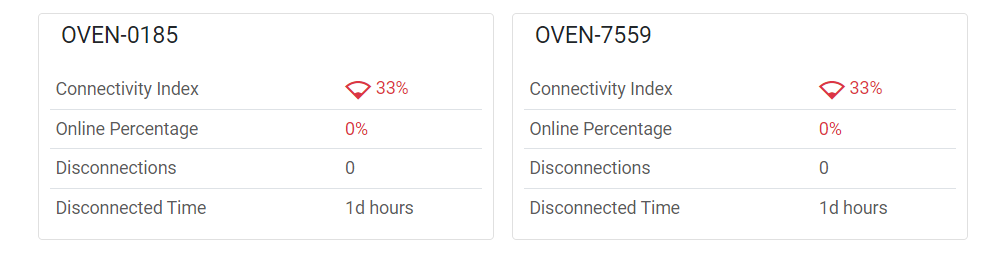
</value-widget>Thing Grid
Displays the connection insight of multiple machines through a thing grid widget.
It can be used in a general-purpose page, either as a standalone page or as a fragment combined with other templates.
Template name | connection_thing_grid |
Usage | General Page |
Target users | Operation Manager, Service Manager |
<div class="d-flex flex-wrap components-row">
<thing-grid-widget template="connection_thing_card_detailed" class="w-100"></thing-grid-widget>
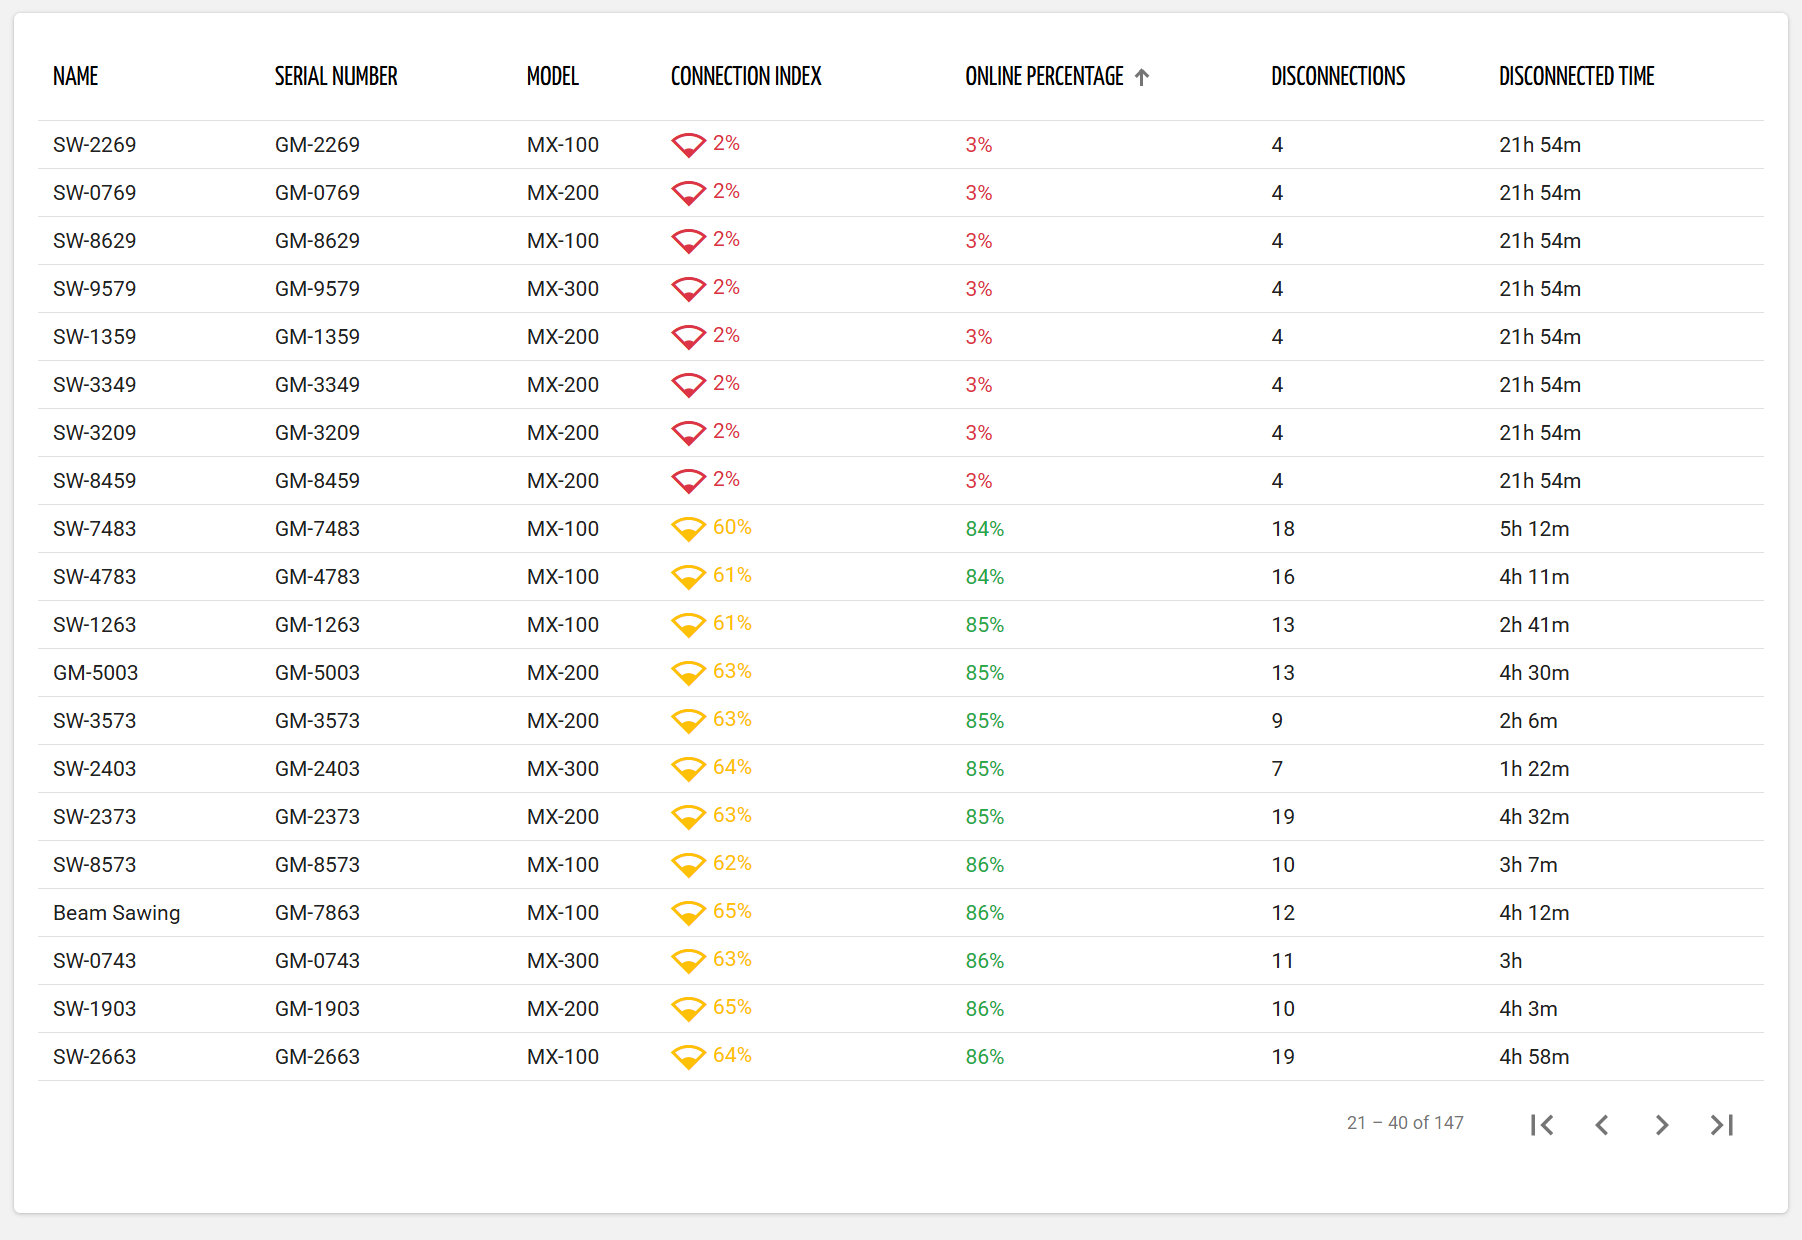
</div>Thing List
Display a list of things with additional columns related to the connection.
It can be used in a general-purpose page, either as a standalone page or as a fragment combined with other templates.
Template name | connection_thing_list |
Usage | General Page |
Target users | Any |
<div class="d-flex flex-wrap components-row">
	<thing-list-widget-v2 [enableActions]="false" [controlsEnabled]="false" [sort]="['properties.connection_index_LAST_30_DAYS','desc']" [pageSize]="20" class="w-100">
		<property name="name"></property>
		<property name="serialNumber"></property>
		<property name="productModel.name" label="Model"></property>
		<property name="properties.connection_index_LAST_30_DAYS" label="Connection Index" filter="integerFormat|dictionary:{'showIcon':true,'showValue':true,'showLabel':false}"></property>
		<property name="properties.connection_index_online_time_perc_LAST_30_DAYS" label="Online Percentage" filter="integerFormat|dictionary:{'showIcon':true,'showValue':true,'showLabel':false}"></property>
		<metric name="connection_index_disc_count" label="Disconnections" filter="integerFormat"></metric>
		<metric name="connection_index_offline_time" label="Disconnected Time" filter="millisToPeriod"></metric>
	</thing-list-widget-v2>
</div>
Configuration
Here are some tips for integrating the Connection Index within your DPS, supporting the various users who need to know how products are connected to the cloud.
The templates provided by this component can be used inside main pages, tabs, or embedded into cards.
Connection Page
For the Service Manager and Sales Manager, you can add a main page called Connection, which provides these users with a connection index overview of the customers.
To add the Connection page, you should:
Enter the Interfaces / Views page.
Select the General tab and then the View you want to modify (e.g., Service Manager).
Press the Add Page button and provide the required information.
As the icon for the menu item, you can use one of the images in the Resources paragraph below.
Press the Add Sub Page button and provide the required information.
Select the connection_index_customers_overview template.
Confirm and save the page.
For the Service Manager view, you also need to configure an additional page:
Enter the Service Manager view.
Select the Customer details page.
Add a sub-page named Connection, set the navigation as Tab, and the path as connection.
Select the template named connection_customer_details.
Resources
You can use the following icons in case the page is visible into a menu.
Dark | Light |
|---|---|
For more icons, you can refer to this page.