Displays metric or statistic data through columns in a bar chart.
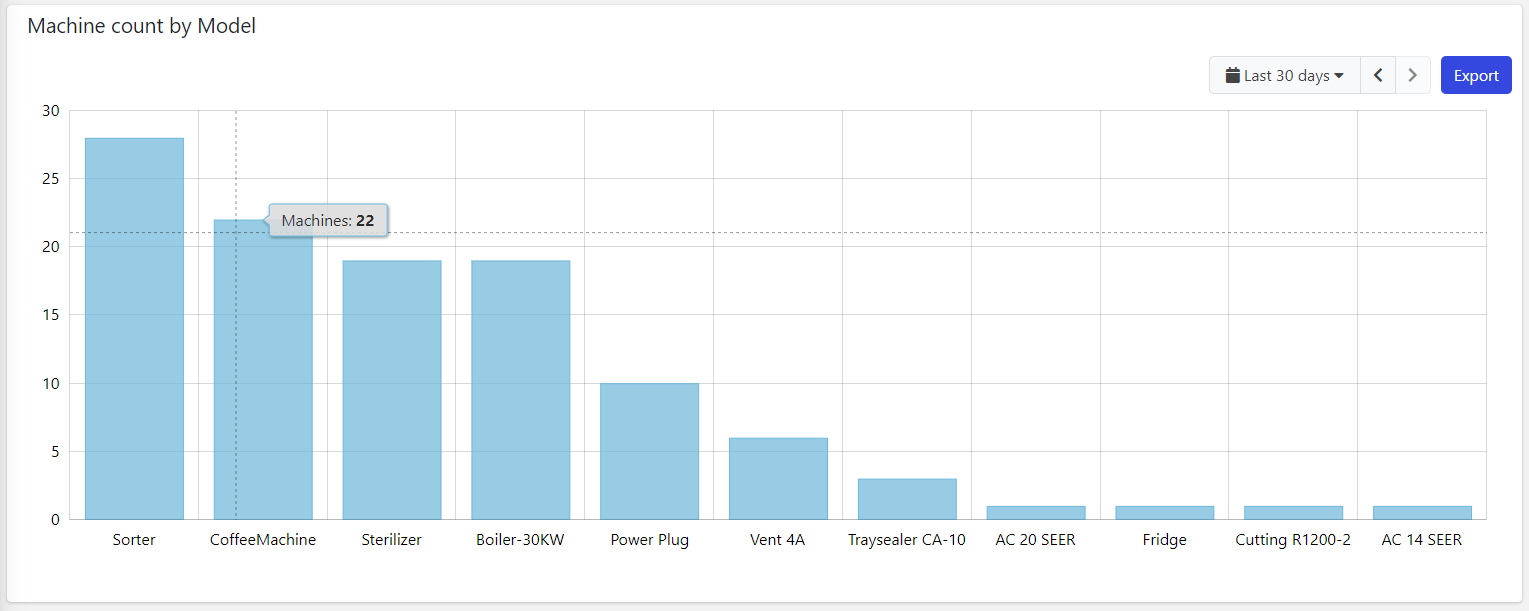
This chart uses a category-based X-axis, so you must use this widget to load aggregated data, for instance, the count of machines grouped by model name.
Pareto Line
When displaying event statistics, for instance, the count or sum of elapsed time from each event, it is possible to display the Pareto Line on the bars sorted by decreasing value.
For example, the image below displays the total time spent by the machine for each fault event type.
The Pareto Line enables the DPS user (e.g., technician, operations manager) to focus on the events that generate the most downtime.
.png?sv=2026-02-06&spr=https&st=2026-10-20T03%3A55%3A14Z&se=2026-10-20T04%3A07%3A14Z&sr=c&sp=r&sig=HXYlQ31gMkB09G7PLB%2Bt9gKXeTLuycYXDBUEl%2BYScAE%3D)
In this case, the first two event types allocate 79% of the total failure time.
So it will be sufficient to try to solve these two problems to increase the machine's uptime, even noticeably (80-20 rule).
The other events, those after 79%, are currently less important.
To configure the Pareto Line, you must:
In the Statistics, select the option Sorting as descending.
On the Bar Chart, enable the option, Show Pareto Line.
Multiple Things Charting
The Bar Chart can also be placed within the Location or Custom details, and display the data aggregated on the underlying objects.
For instance, in a customer details page, you can display the count of failures over a period aggregated by product.
.png?sv=2026-02-06&spr=https&st=2026-10-20T03%3A55%3A14Z&se=2026-10-20T04%3A07%3A14Z&sr=c&sp=r&sig=HXYlQ31gMkB09G7PLB%2Bt9gKXeTLuycYXDBUEl%2BYScAE%3D)
Optionally, you can change the set of things the chart is working on by coupling it with a Search Field available on the same page.
Template Syntax
Below you can find some examples of how to use the component within a template.
        <bar-chart-widget-v2 title="Alert Count">
        <statistic resource="alert" aggregation="COUNT" groupBy="MONTH"></statistic>
        </bar-chart-widget-v2>
Component Reference
Here is a comprehensive list of all the elements and properties that can be used to configure the component.
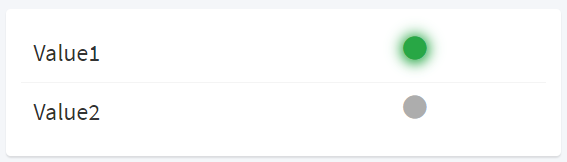
Green/Gray Led | Converts the boolean value into a GREEN or GRAY led. Name: greenGrayLed Input Types: BOOLEAN, STRING, INTEGER Output Type: HTML |
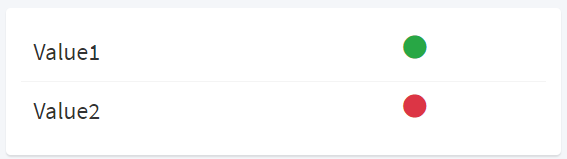
Green/Red Circle | Converts the boolean value into a GREEN or RED circle. Name: greenRedCircle Input Types: BOOLEAN, STRING, INTEGER Output Type: HTML |
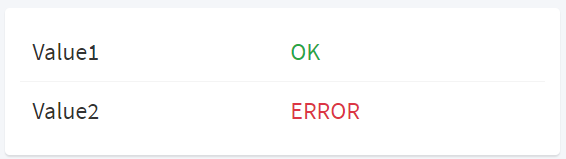
OK/Error | Converts the boolean value into a colored Ok or ERROR text. Name: okError Input Types: BOOLEAN, STRING, INTEGER Output Type: HTML |
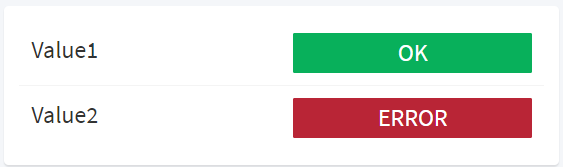
OK/Error Badge | Converts the boolean value into a colored OK or ERROR badge. Name: okErrorBadge Input Types: BOOLEAN, STRING, INTEGER Output Type: HTML |
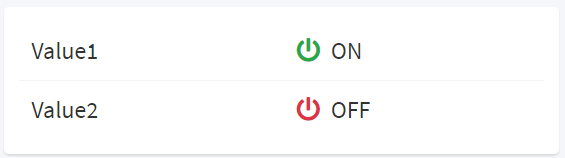
On/Off Icon | Converts the boolean value into a POWER-ON or POWER-OFF icon with status text. Name: onOffIcon Input Types: BOOLEAN, STRING, INTEGER Output Type: HTML |
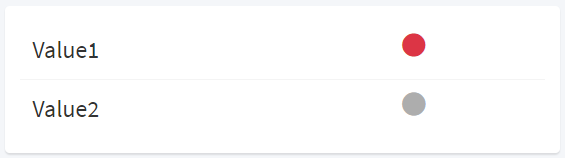
Red/Gray Circle | Converts the boolean value into a RED or GRAY circle. Name: redGrayCircle Input Types: BOOLEAN, STRING, INTEGER Output Type: HTML |
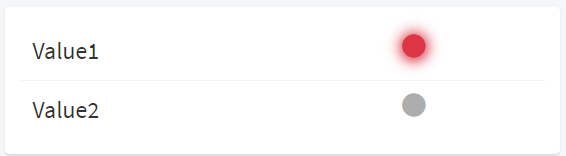
Red/Gray Led | Converts the boolean value into a RED or GRAY led. Name: redGrayLed Input Types: BOOLEAN, STRING, INTEGER Output Type: HTML |
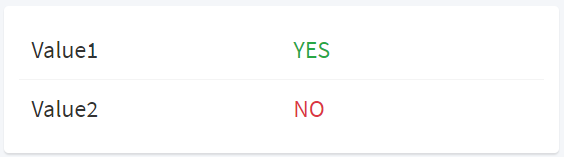
Yes/No | Converts the boolean value into a colored YES or NO text. Name: yesNo Input Types: BOOLEAN, STRING, INTEGER Output Type: HTML |
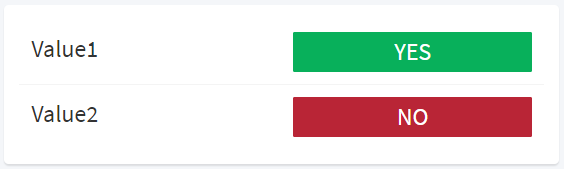
Yes/No Badge | Converts the boolean value into a colored YES or NO badge. Name: yesNoBadge Input Types: BOOLEAN, STRING, INTEGER Output Type: HTML |