---
title: "Pie Chart V2"
slug: "pie-chart-widget-v2"
updated: 2026-11-09T09:28:42Z
published: 2026-11-09T09:28:42Z
canonical: "learn.servitly.com/pie-chart-widget-v2"
---
> ## Documentation Index
> Fetch the complete documentation index at: https://learn.servitly.com/llms.txt
> Use this file to discover all available pages before exploring further.
# Pie Chart V2
Displays a pie or donut chart with one slice for each loaded value.
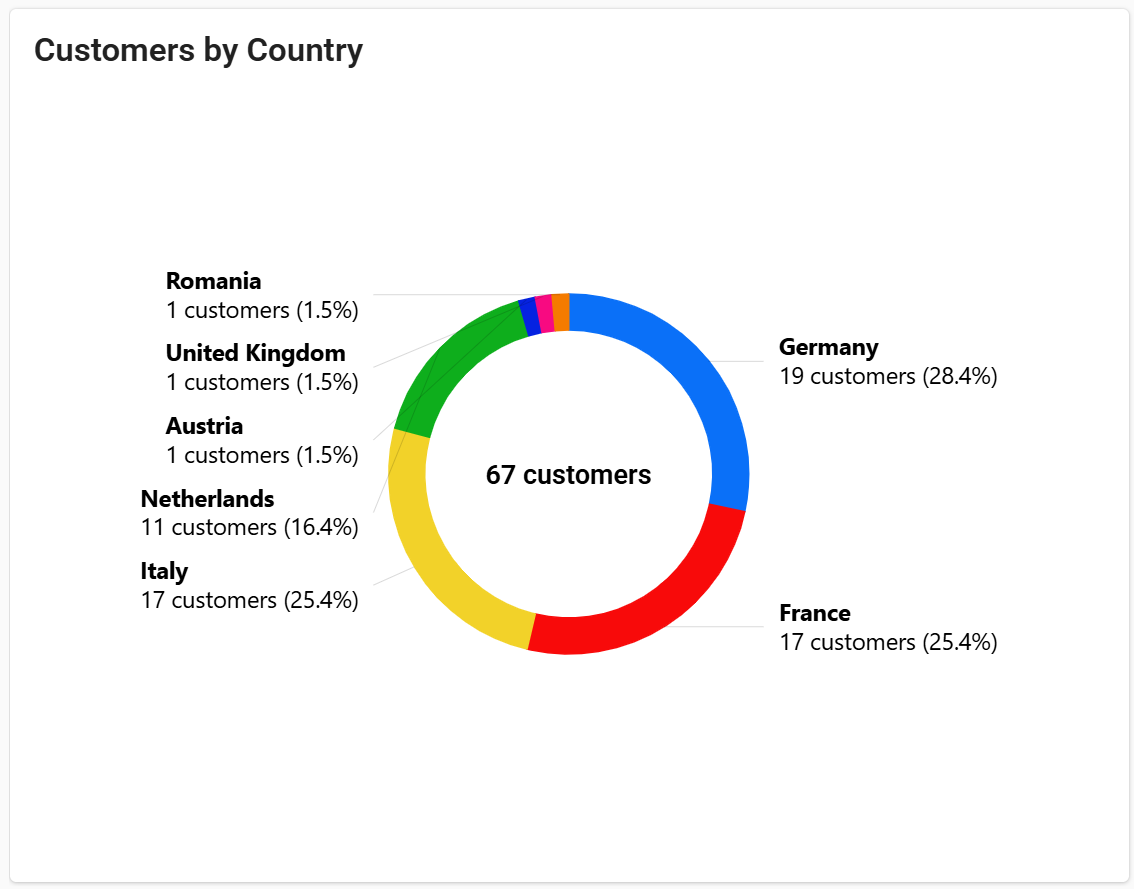
The Pie Chart shows how a total is split into parts, so DPS users can see at a glance which slice is the largest. For instance, it can show in which countries most of the installed base is located, which event types occur most often, or how a machine's working time is divided across its operating states.
Each slice represents a value loaded from a metric or from a statistic, and its size is proportional to that value's share of the total.
> Pie charts are easiest to read with a few slices. If the data is split into many categories, or you need to compare values over time, use the Bar Chart instead.
## Metrics
Each *Metric* sub-element adds one slice to the chart, labeled with the metric name or with the custom Label, if defined. Use metrics when the values are parts of the same whole and share the same unit, such as the hours spent by a machine in each operating state, or the energy consumed by each subpart. Through the Aggregation property, you can choose how the metric values are aggregated (`MIN`, `MAX`, `AVG`, `DELTA`, `SUM`). Without aggregation, the Pie chart uses the latest available value of the metrics within the input period. For instance, with counter metrics tracking the hours spent in each state, DELTA returns the hours accumulated over the period, so the chart shows how the working time was split across states.
## Statistics
A *Statistic* computes values from the items of a *Resource* (for instance, things, alerts, events, or work sessions) by applying an *Aggregation* function, such as `COUNT` to count the items, or `SUM` to add up the values of a *Property*. By setting *Group By*, results are split by the values of a property, and each group becomes a slice of the pie. For instance, counting things grouped by `customer.country` shows how the installed base is distributed across countries (one slice per country).
To narrow down the items included in the statistic, you can:
- Define conditions in the *Query* property, for instance, to include only connected products.
- For events and alerts, use *Status* to include those currently active (`ACTIVE`), or those activated within the selected period (`ACTIVATED`).
- Limit the number of returned results through the *Max Result Count option*.
#### Grouping by Value Ranges
When *Group By* refers to a numeric property with min and max values, set *Interval Count* to divide that range into intervals, each displayed as a slice. For instance, you can show how many things fall within each range of a numeric property. Enable *Include Empty Intervals* to also display intervals with no results.
## Data Period
Metric aggregations and statistics on time-based items, such as events activated within the period, are computed over a period. When the page is opened, the chart loads the data of the *Default Loading Period* (the last 7 days, unless otherwise configured). To let DPS users choose the period, add a [Period Field](/v1/docs/period-field-v2) to the same page and reference its ID in the `Period Variable` property.
## Multiple Things Charting
The Pie Chart can also be placed within the Customer or Location details pages, or even in the overview page of an organization or partner user. In this case, statistics are computed on the items related to the page context. For instance, in a customer details page, you can display the active events of all the customer's products grouped by severity.
In addition to statistics, in a multi-thing context (e.g., the location details), you can display aggregated data of a thing metric (use the `thing.` prefix in the metric name). For each thing in the context, the pie chart displays a slice with the corresponding aggregated value of the metric.
Optionally, you can change the set of things, or statistic’s items, the pie chart is working on by coupling it with a [Search Field](/v1/docs/search-field) available on the same page, referenced in the `Query Variable` property.
## Chart Layout
By default, the chart is displayed as a donut, with the total in the center. Set *Pie Layout* to `PIE` to display a standard pie. Each slice is labeled with its name and, depending on *Displayed Value*, with its value, its percentage of the total, or both. Use *Slice Label Position* to place the labels outside the chart, horizontally or along the circle, or to hide them. Use *Legend Position* to display a legend at the bottom or on the right of the chart.
Slices are sorted by decreasing value. Set *Slice Sorting* to `BY_NAME_ASC` to sort them alphabetically instead.
To format the displayed values, set a *Unit* (e.g., *customers* in the image above) and a *Value Filter*, which apply to all the values in the chart.
## Data Export
Select *Export Enabled* to let DPS users export the data displayed in the chart.
## Template Syntax
Below you can find some examples of how to use the component within a template.
**Example 1:** Displays how the installed base is distributed across countries.
```xml
```
**Example 2:** Displays the currently active events grouped by severity.
```xml
```
**Example 3:** Displays how the working time was split across operating states, using counter metrics.
```xml
```
**Example 4:** Displays how the production was split across different machines, using the same metric.
```xml
```
**Example 5:** Displays the installed base by country as a standard pie, showing only percentages, with slices sorted by name and a legend at the bottom.
```xml
```
## Component Reference
Here is a comprehensive list of all the elements and properties that can be used to configure the component.
#### Pie Chart NEW `<pie-chart-widget-v2>`
| *Displayed Value* | The information displayed for each slice: percentage, value, or both. **Name**: config.displayedValue **Type**: ENUM \| Optional **Values**: *PERCENTAGE_AND_VALUE*, *PERCENTAGE*, *VALUE* **Default Value**: *PERCENTAGE_AND_VALUE* `[config]="{displayedValue: 'PERCENTAGE_AND_VALUE'}"` |
| --- | --- |
| *Legend Position* | The position of the legend in the widget. **Name**: config.legendPosition **Type**: ENUM \| Optional **Values**: *NONE*, *BOTTOM*, *RIGHT* **Default Value**: *NONE* `[config]="{legendPosition: 'NONE'}"` |
| *Pie Layout* | The chart layout: standard pie or donut. **Name**: config.mode **Type**: ENUM \| Required **Values**: *PIE*, *DONUT* **Default Value**: *DONUT* `[config]="{mode: 'PIE'}"` |
| *Show Total* | If enabled, the total is displayed in the center of the donut. **Name**: config.showTotal **Type**: BOOLEAN \| Optional **Default Value**: *true* `[config]="{showTotal: false}"` |
| *Slice Label Position* | The position of the labels displayed next to each slice. **Name**: config.sliceLabelPosition **Type**: ENUM \| Required **Values**: *HORIZONTAL_OUTSIDE*, *CIRCULAR_OUTSIDE*, *NONE* **Default Value**: *HORIZONTAL_OUTSIDE* `[config]="{sliceLabelPosition: 'HORIZONTAL_OUTSIDE'}"` |
| *Slice Sorting* | The criterion used to sort slices in the chart. **Name**: config.sort **Type**: ENUM \| Optional **Values**: *BY_NAME_ASC*, *BY_VALUE_DESC* **Default Value**: *BY_VALUE_DESC* `[config]="{sort: 'BY_NAME_ASC'}"` |
| *Title* | The title displayed at the top of the widget. **Name**: title **Type**: STRING \| Optional `[title]="'abc'"` |
| *Unit* | The unit of measurement displayed next to values. **Name**: config.unit **Type**: STRING \| Optional `[config]="{unit: 'hours'}"` |
| *Value Filter* | The filter used to format all values. **Name**: config.filter **Type**: FILTER \| Optional `[config]="{filter: 'dateFormat'}"` |
| **Data** |
| *Default Loading Period* | The default period used to filter data when the page is opened. **Name**: config.defaultPeriod **Type**: PERIODS \| Optional **Default Value**: *LAST_7_DAYS* `[config]="{defaultPeriod: 'LAST_30_DAYS'}"` |
| *Period Variable* | The ID of the page variable providing the filtering period (e.g. the ID of a ). **Name**: inputs.period **Type**: STRING \| Optional `[inputs]="{period: 'abc'}"` |
| *Query Variable* | The ID of the page variable providing the search criteria (e.g. the ID of a ). **Name**: inputs.query **Type**: STRING \| Optional `[inputs]="{query: 'abc'}"` |
| **Rendering** |
| *Availability* | The Digital Plan or Add-on features required to display the widget. **Name**: hasFeature **Type**: FEATURE (multiple) \| Optional `[hasFeature]="['feature_a', 'feature_b']"` |
| *CSS Class* | The CSS class name(s) used to customize the widget layout. **Name**: class **Type**: STRING \| Optional `class="abc"` |
| *Height* | The height in pixels of the widget. **Name**: config.height **Type**: STRING \| Optional **Default Value**: *480* `[config]="{height: '480px'}"` |
| *Visibility Condition* | The expression that determines whether the widget is displayed. **Name**: *ngIf **Type**: STRING \| Optional `*ngIf="abc"` |
| **Controls** |
| *Export Enabled* | The boolean flag indicating whether the data export is enabled. **Name**: config.exportEnabled **Type**: BOOLEAN \| Optional **Default Value**: *false* `[config]="{exportEnabled: true}"` |
| **Sub Elements** |
| [*Metric*](/docs/pie-chart-widget-v2/#metric) | |
| [*Statistic*](/docs/pie-chart-widget-v2/#statistic) | |
#### Metric `<metric>`
| *Aggregation* | The aggregation applied to the metric values. **Name**: aggregation **Type**: AGGREGATION \| Optional **Functions**: *MIN*, *MAX*, *AVG*, *DELTA*, *SUM* `aggregation="SUM"` |
| --- | --- |
| *Filter* | The filter used to transform the displayed values. **Name**: filter **Type**: FILTER \| Optional `filter="dateFormat"` |
| *Label* | The custom label displayed instead of the metric name. **Name**: label **Type**: STRING \| Optional `label="abc"` |
| *Name* | The metric whose value is used as the slice value. **Name**: name **Type**: METRIC \| Required `name="metricName"` |
#### Statistic `<statistic>`
| *Aggregation* | The function used to aggregate the items. **Name**: aggregation **Type**: ENUM \| Optional **Values**: *AVG*, *COUNT*, *MAX*, *MIN*, *SUM*, *LAST* `aggregation="AVG"` |
| --- | --- |
| *Averaged By* | The count used to average the statistic results (e.g. average alert count per thing). **Name**: averagedBy **Type**: ENUM \| Optional **Values**: *thingCount* `averagedBy="thingCount"` |
| *Filter* | The filter used to transform the displayed values. **Name**: filter **Type**: FILTER \| Optional `filter="dateFormat"` |
| *Group By* | The property used to group results (e.g. customer.country). For time-based items, results can also be grouped by HOUR, DAY, MONTH, or YEAR. **Name**: groupBy **Type**: GROUP_BY \| Optional `groupBy="prop1"` |
| *Include Empty Intervals* | If enabled, intervals with no results are also displayed. **Name**: config.includeEmptyGroups **Type**: BOOLEAN \| Optional **Default Value**: *false* `[config]="{includeEmptyGroups: true}"` |
| *Interval Count* | The number of intervals into which results are divided when grouping by a property with min and max values. **Name**: config.intervalCount **Type**: INTEGER \| Optional `[config]="{intervalCount: 123}"` |
| *Label* | The custom label displayed for the statistic. **Name**: label **Type**: STRING \| Optional `label="abc"` |
| *Property* | The item property whose values are aggregated. **Name**: property **Type**: PROPERTY \| Optional `property="propName"` |
| *Resource* | The resource whose items are used to calculate the statistic. **Name**: resource **Type**: ENUM \| Required **Values**: *ACTION*, *ALERT*, *EVENT*, *CUSTOMER*, *LOCATION*, *PARTNER*, *THING*, *USER*, *WORK_SESSION* `resource="ACTION"` |
| *Status* | The events or alerts to include: those currently active, or those activated within the selected period. **Name**: activationType **Type**: ENUM \| Optional **Values**: *ACTIVE*, *ACTIVATED* `activationType="ACTIVE"` |
| **Data** |
| *Max Result Count* | The maximum number of results returned. If empty, all results are returned. **Name**: limit **Type**: INTEGER \| Optional `limit="123"` |
| *Query* | The conditions items must match to be included (e.g. [query]='[{'property': 'connectionStatus', 'predicate': 'eq', 'value': '1'}]'). Supported predicates: eq, beginsWith, like, notLike, isEmpty, isNotEmpty, gt, gte, lt, lte. **Name**: query **Type**: QUERY \| Optional **Predicates**: *beginsWith*, *eq*, *neq*, *gt*, *gte*, *isEmpty*, *isNotEmpty*, *lt*, *lte*, *like*, *notLike* `[query]="[{property:'prop1', predicate: 'eq', value: 'foo'}, {property:'prop2', predicate: 'in', value: ['bar', 'baz']}]"` |
## Full Syntax Example
```xml
```