---
title: "Heat Map"
slug: "heat-map-widget"
updated: 2026-10-30T11:30:32Z
published: 2026-10-30T11:30:32Z
canonical: "learn.servitly.com/heat-map-widget"
---
> ## Documentation Index
> Fetch the complete documentation index at: https://learn.servitly.com/llms.txt
> Use this file to discover all available pages before exploring further.
# Heat Map
The Heat Map widget shows how a metric is distributed across the days of the week and the hours of the day, helping users spot recurring usage patterns, peak hours, and idle windows at a glance.
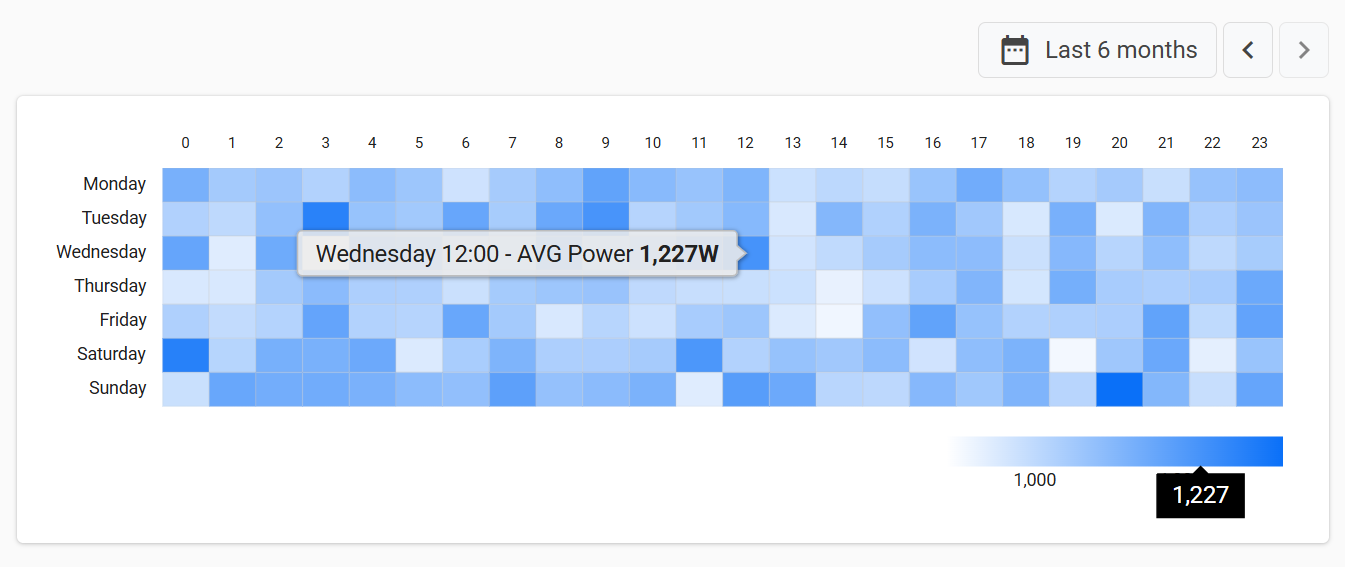
Note that the widget works in the context of a single thing.
## How It Works
The widget displays a grid that crosses the days of the week (Monday to Sunday) with the hours of the day (0 to 23). Each cell represents a weekday-hour slot, and its value is computed by aggregating all the metric values that fall into that slot over the input period. For example, with the Last 30 days period, the Tuesday – 9 cell aggregates all the values received on every Tuesday between 9:00 and 9:59 within those 30 days. Cells are colored on a scale ranging from the *Min Value Color*, associated with the lowest aggregated value, to the *Max Value Color*, associated with the highest one. Slots with similar values share similar colors, so recurring patterns and outliers stand out immediately. By moving the mouse over a cell, a tooltip displays the aggregated value, formatted according to the metric Label, Unit, and Value Filter.
Typical Use Cases:
- *Usage patterns*: understand when a product is typically operated during the week (e.g., working hours, shifts, weekends).
- *Peak detection*: identify recurring hourly peaks of consumption, load, pressure, or temperature.
- *Activity planning*: find low-usage windows to schedule maintenance, firmware updates, or remote commands.
## Aggregation Function
Through the *Aggregation Function* property, you can choose how the values of each slot are aggregated:
- *AVG*: Returns the average value of the slot. Suitable for continuous measurements such as temperature, pressure, or power.
- *SUM*: Returns the sum of all values of the slot. Pay attention that all values are summed, so if applied to a counter metric (e.g., total energy or total working hours), you will get unexpected results.
- *MIN*: Returns the minimum value of the slot.
- *MAX*: Returns the maximum value of the slot. Useful for highlighting peaks.
The default aggregation is AVG. If no values are stored for a slot within the selected period, the cell has no aggregated value.
## Period Selection
When entering the page, the widget loads data for the *Default Loading Period* (Last 7 days if not specified). To let users change the period, you can place a [Period Field](/v1/docs/period-field-v2) on the same page and reference its ID through the *Period Variable* property. Whenever the user selects a new period, the heat map is reloaded accordingly.
> Since each cell aggregates the same weekday-hour slot across multiple weeks, periods shorter than one week leave some cells empty, while longer periods (e.g., Last 30 days) produce more representative patterns.
## Template Syntax
Below you can find some examples of how to use the component within a template.
```xml
```
##
## Component Reference
Here is a comprehensive list of all the elements and properties that can be used to configure the component.
#### Heat Map `<heat-map-widget>`
| *Max Value Color* | The color associated to the maximum value into the heat map. **Name**: config.maxColor **Type**: STRING \| Optional `[config]="{maxColor: '#007BFF'}"` |
| --- | --- |
| *Min Value Color* | The color associated to the minimum value into the heat map. **Name**: config.minColor **Type**: STRING \| Optional `[config]="{minColor: '#007BFF'}"` |
| *Title* | The title displayed on the top part of the widget box. **Name**: title **Type**: STRING \| Optional `[title]="'Heat Map'"` |
| **Data** |
| *Default Loading Period* | The default filtering period applied when entering the page. **Name**: config.defaultPeriod **Type**: PERIODS \| Optional **Default Value**: *LAST_7_DAYS* `[config]="{defaultPeriod: 'LAST_30_DAYS'}"` |
| *Period Variable* | The id of the page's variable providing the date range filtering period, for instance the id of a . **Name**: inputs.period **Type**: STRING \| Optional `[inputs]="{period: 'abc'}"` |
| *Query Variable* | The id of the page's used to filter things. **Name**: inputs.query **Type**: STRING \| Optional `[inputs]="{query: 'abc'}"` |
| **Rendering** |
| *Availability* | Configure availability based on active features on Digital Plan on Add-ons **Name**: hasFeature **Type**: FEATURE (multiple) \| Optional `[hasFeature]="['feature_a', 'feature_b']"` |
| *CSS Class* | The name(s) of the CSS class used to customize the widget layout. **Name**: class **Type**: STRING \| Optional `class="abc"` |
| *Visibility Condition* | The expression that allows you to reduce the visibility of the element. **Name**: *ngIf **Type**: STRING \| Optional `*ngIf="getUser().organizationId != null"` |
| **Sub Elements** |
| [*Metric*](/docs/heat-map-widget/#metric) | The metric whose current value must be displayed within the gauge box. |
#### Metric `<metric>`
| *Aggregation* | The function used to compute aggregated values for each cell in the heat map. **Name**: aggregation **Type**: ENUM \| Optional **Values**: *AVG*, *SUM*, *MIN*, *MAX* **Default Value**: *AVG* `aggregation="AVG"` |
| --- | --- |
| *Label* | The metric alternative label displayed in the tooltip. **Name**: label **Type**: STRING \| Optional `label="abc"` |
| *Name* | The metric whose value(s) must be loaded by the widget. **Name**: name **Type**: METRIC \| Required `name="metricName"` |
| *Unit* | The unit of measurement to be displayed along the value. **Name**: unit **Type**: STRING \| Optional `unit="°C"` |
| *Value Filter* | The name of the filter used to transform metric values. **Name**: filter **Type**: FILTER \| Optional `filter="dateFormat"` |
## Full Syntax Example
```xml
```